3

Plotting several series in a same plot display is possible and also several subplots in a display. But I want several plots which can be completely different things (not necessarily a series or graph of a map) to be displayed exactly in one frame. How can I do that? In Maple you assign names for each plot like P1:=...:, P2:= ...: and then using plots:-display(P1,P2,...); and it works. But I want to do this in Julia. Let's say I have the following plots as an example;

using Plots
pyplot()
x=[1,2,2,1,1]
y=[1,1,2,2,1]
plot(x,y)

p1=plot(x,y,fill=(0, :orange))

x2=[2,3,3,2,2]
y2=[2,2,3,3,2]
p2=plot(x2,y2,fill=(0, :yellow))

Now how to have both P1 and P2 in one plot? I don't one a shortcut or trick to write the output of this specific example with one plot line, note that my question is general, for example p2 can be a curve or something else, or I may have a forflow which generates a plot in each step and then I want to put all those shapes in one plot display at the end of the for loop.


Code for a simple example of trying to use plot!() for adding to a plot with arbitrary order.

using Plots
pyplot()
x=[1,2,2,1,1]
y=[1,1,2,2,1]
p1=plot(x,y,fill=(0, :orange))

x2=[2,3,3,2,2]
y2=[2,2,3,3,2]
p2=plot!(x2,y2,fill=(0, :orange))

p3=plot(x,y)

display(p2)

p5=plot!([1,2,2,1,1],[2,2,3,3,2],fill=(0, :green))

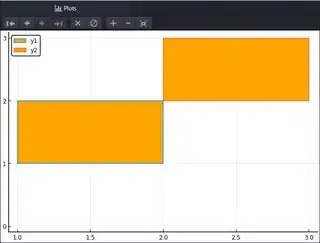
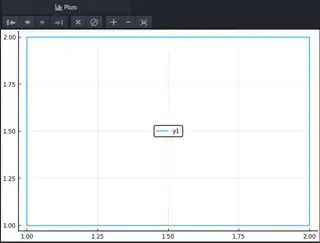
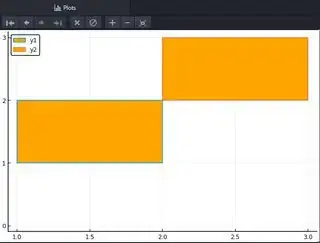
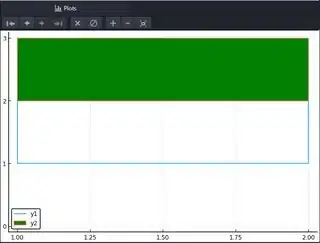
By running the above code I see the following plots respectively. enter image description here enter image description here enter image description here enter image description here enter image description here
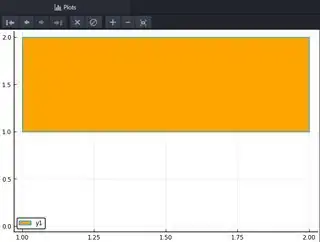
But what I expected to see is a plot with the green rectangle added inside the plot with the two orange rectangles.

  • 2
    For those that doesn't know Maple, it's hard to understand what you are looking for. With plot!() you can add to the same frame pretty different things.. an histogram, and then a line chart, and then a bubble chart.... If this is not what you want, you should show an image of what you want to achieve... – Antonello Aug 29 '19 at 11:40
  • @Antonello thank you, `plot!()` works. But there is one drawback about `plot!()`, and that is this way you add the current plot to the last previous plot. So it forces you to necessarily have the plots that you want to be printed in the same frame exactly after each other. While the method in Maple give you the freedom to define plots and then you can have any combination of them wherever in the program that you want. Is there by any chance any other command in Plots package of Julia or any other plotting package of Julia that gives such a freedom? – AmirHosein Sadeghimanesh Aug 31 '19 at 14:22
  • 1
    Vegalite may allow you to do that. – Michael K. Borregaard Sep 01 '19 at 04:58
  • Still I don't get what you want.. you can save the individual plots in variables, and then display them wherever you want across the program, it is just that `plot() ` by default display the latest plot made.. – Antonello Sep 01 '19 at 14:57
  • @Antonello can you check the code I added at the end of the question? Although I ask Julia to display `P2` before `P4=plot!()`, it is still adding `P4` to `P3`. Maybe I'm doing something wrong otherwise it seems `plot!()` is only adding to the last new plot. – AmirHosein Sadeghimanesh Sep 02 '19 at 10:02
  • @MichaelK.Borregaard thank you for introducing Vega-Lite, I'll check it out. – AmirHosein Sadeghimanesh Sep 02 '19 at 10:22

3 Answers3

2

The way to plot several series within the same set of axes is with the plot! function. Note the exclamation mark! It's part of the function name. While plot creates a new plot each time it is invoked, plot! will add the series to the current plot. Example:

plot(x, y)
plot!(x, z)

And if you are creating several plots at once, you can name them and refer to them in plot!:

p1 = plot(x, y)
plot!(p1, x, z)
PatrickT
  • 10,037
  • 9
  • 76
  • 111
vinnief
  • 742
  • 10
  • 13
  • 1
    I wanted to upvote @PatrickT 's clarification, but cannot upvote a post that I started. Thanks PatrickT – vinnief May 25 '21 at 12:20
0

Well, if you do that, what you will have is subplots, technically. That's what it means. The syntax is

plot(p1, p2)
Michael K. Borregaard
  • 7,864
  • 1
  • 28
  • 35
0

Sorry, I don't know how to plot a whole plot (conversely to a series) over an other plot.. For what it concerns the order of the plots, you can create as many plots as you want without display them and then display them wherever you want, e.g.:

using Plots
pyplot()

# Here we create independent plots, without displaying them:
x=[1,2,2,1,1]
y=[1,1,2,2,1]
p1=plot(x,y,fill=(0, :orange));
x2=[2,3,3,2,2]
y2=[2,2,3,3,2]
p2=plot(x2,y2,fill=(0, :orange));
p3=plot(x,y);
p5=plot([1,2,2,1,1],[2,2,3,3,2],fill=(0, :green));

# Here we display the plots (in the order we want):
println("P2:")
display(p2)
println("P3:")
display(p3)
println("P5:")
display(p5)
println("P1:")
display(p1)
Antonello
  • 6,092
  • 3
  • 31
  • 56