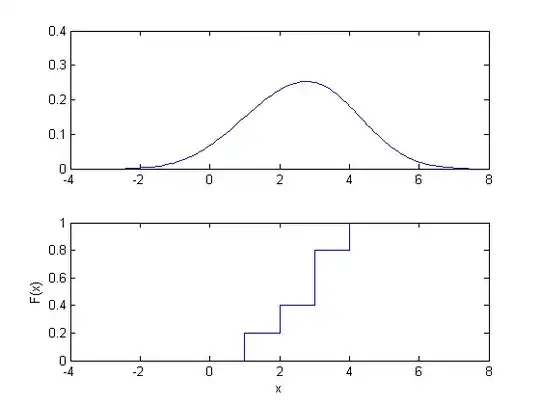
x = [1 2 3 3 4]
cdfplot(x)
After Googling, I find the above code will draw a cumulative distribution function for me in Matlab.
Is there a simple way to draw a probability density function?
To Clarify. I need a graph that has an evenly distributed x-axis. And I would prefer it does not look like a bar graph. (I would have millions of integers)
Sorry, update again. My data are integers, but actually they represents time(I expect several quite high peak at exact same value while other value should look like as if they are not discrete). I'm actually starting to wonder if this is actually not discrete integers inherently. CDF would definitely work, but when coming to PDF, it seems it's more complicated than I anticipated.