3

We are developing an app service over Azure with Web API and .NET framework 4.6.2. We're doing some load test and these are giving us some spikes.

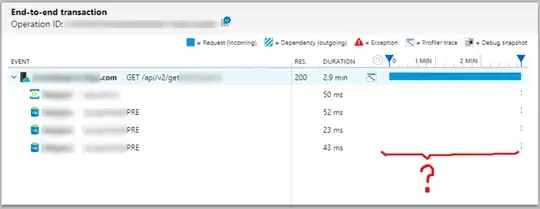
If we go deep in the transactions that are returning these spikes, we can see this:

RequestSample

As you can see, after returning the response (we check this with an event just before the return) there is a lot of time wasted in something. What is this something and how can we avoid it?

Less times this wasted time happens before processing the request as you can see here:

RequestSample2

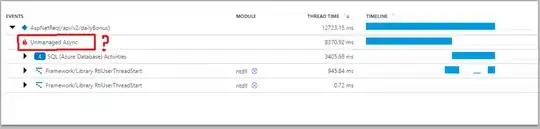
Going even deeper (but in others requests), into the profiler traces, we find "Unmanaged Async". But we don't understand very well what is that and the way to avoid it. Can this "Unmanaged Async" be the cause of the wasted time?

ProfilerTrace

nyxtez37
  • 61
  • 5
  • Does this start after a specific number of concurrent requests? If so, it may be due to requests being queued by ASP.NET. – Bernard Vander Beken Aug 13 '19 at 15:18
  • The load tests were with 1300-2000 requests by second. But, can the requests being queued the cause of the wasted time AFTER the request being processed? – nyxtez37 Aug 13 '19 at 15:28
  • Ever figured it out? We are facing the same issue. Intermittent spike that comes and go, where unmanaged async takes a LONG time... then disappear. – LightStriker Aug 03 '20 at 01:43

1 Answers1

0

.Net framework emits ETW events and passes activity ids between threads so that async calls can be tracked across threads. Unmanaged code (native code) and some older styles of asynchronous code are missing these events and activity ids, so the profiler cannot track which thread is running code and what code is running. This is labeled 'unmanaged async' in the call stack. If you download the ETW file, you may be able to use perfview to get more insight into what is happening.

https://github.com/Microsoft/perfview/blob/master/documentation/Downloading.md

https://learn.microsoft.com/en-us/azure/azure-monitor/app/profiler-overview

Hope it helps.

Mohit Verma
  • 5,140
  • 2
  • 12
  • 27
  • Thanks, we have already readen that description from [here](https://learn.microsoft.com/en-us/azure/azure-monitor/app/profiler-overview#how-to-read-performance-data) and used the perfview but we don't know what we have to look for there. – nyxtez37 Aug 14 '19 at 08:19