-2

I have 5 markers on 5 different cities (Aberdeen, Edinburgh, Glasgow, Inverness, Dundee) I need to display this information in a chart on mouseclick.

On Mouseclick:
Edinburgh: Science Fiction - 55, Comedy - 33,Thriller- 21 ,Action - 63, Romance - 17

Glasgow: Science Fiction- 25, Comedy- 42, Thriller-16, Action-29, Romance-21

Aberdeen: Science Fiction-31,Comedy-19, Thriller-41, Action-38, Romance-45

Dundee: Science Fiction- 22, Comedy-4,Thriller-22,Action-33,Romance-26

Inverness:Science Fiction-41,Comedy-27,Thriller-13,Action-15,Romance-19

I currently have code for an infoWindow for Edinburgh but nothing happens when I click the marker.

Link to JSFIDDLE

// Initialize and add the map
function initMap() {

  //The location of Inverness
  var inverness = {
    lat: 57.480819,
    lng: -4.224250
  };
  var city1 = {
    position: inverness
  };
  // The map, centered at Inverness
  var map = new google.maps.Map(
    document.getElementById('map'), {
      zoom: 4,
      center: inverness
    });
  // The marker positioned at Inverness
  var marker1 = new google.maps.Marker({
    position: inverness,
    map: map,
    id: 'c1',
    title: 'Number Of Cinemas: 2'
  });

  //The location of Dundee
  var dundee = {
    lat: 56.467546,
    lng: -2.969593
  };
  var city2 = {
    position: dundee
  };
  // The marker, positioned at Dundee
  var marker2 = new google.maps.Marker({
    position: dundee,
    map: map,
    id: 'c2',
    title: 'Number Of Cinemas: 2'
  });

  //The location of Glasgow
  var glasgow = {
    lat: 55.875362,
    lng: -4.250252
  };
  var city3 = {
    position: glasgow
  };
  // The marker, positioned at Glasgow
  var marker3 = new google.maps.Marker({
    position: glasgow,
    map: map,
    id: 'c3',
    title: 'Number Of Cinemas: 11'
  });

  //The location of Edinburgh
  var edinburgh = {
    lat: 55.959425,
    lng: -3.189161
  };
  var city4 = {
    position: edinburgh
  };
  // The marker, positioned at Edinburgh
  var marker4 = new google.maps.Marker({
    position: edinburgh,
    map: map,
    id: 'c4',
    title: 'Number Of Cinemas: 3'
  });

  //The location of Aberdeen
  var aberdeen = {
    lat: 57.155988,
    lng: -2.095139
  };
  var city5 = {
    position: aberdeen
  };
  // The marker, positioned at Aberdeen
  var marker5 = new google.maps.Marker({
    position: aberdeen,
    map: map,
    id: 'c5',
    title: 'Number Of Cinemas: 3'
  });
}

google.charts.load('current', {
  packages: ['corechart']
});

function drawChart(map, marker) {
  //set up data
  var data = google.visualization.arrayToDataTable([
    ['Science Fiction', '55'],
    ['Comedy', '33'],
    ['Thriller', '21'],
    ['Action', '63'],
    ['Romance', '17'],
  ]);
}
//set up any options
var options = {
  title: 'Film Genre Preferences'
};

//Create node
var node = document.createElement('div'),
  infoWindow = new google.maps.InfoWindow(),
  chart = new google.visualization.BarChart(node);

//check which marker it is
if (marker.id == 'c4') {
  chart.draw(data, options);
}
google.maps.event.addListener(marker, 'click', function(mouseclick) {
  drawChart(map, this);

  infoWindow.setContent(node);
  infoWindow.open(map, marker);
});
initialize();
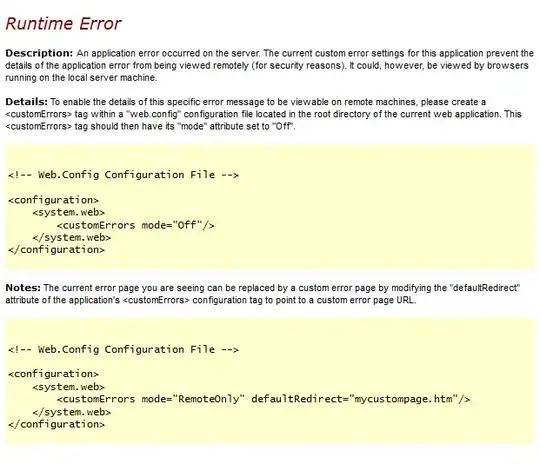
  • I get a javascript error with your fiddle: `Uncaught ReferenceError: google is not defined` – geocodezip Jul 29 '19 at 17:58
  • really? Cause I don't... – MarnieCMaclean Jul 29 '19 at 18:10
  • 1
    There are lots of problems with your code/fiddle. I started an answer, but there are too many issues. I can get the `infoWindow` to open, but then it tells me `Data column(s) for axis #0 cannot be of type string` – geocodezip Jul 29 '19 at 18:28
  • what are the issues? – MarnieCMaclean Jul 29 '19 at 20:15
  • 1
    As I said, I started an answer, but it got to long/complicated (and you didn't believe me about the first issue I found/fixed). Please provide a [mcve] with a single question/problem. ("nothing happens when I click the marker" isn't a vary good problem description). Start with a map with a single marker, fix the `Uncaught ReferenceError: google is not defined` in your fiddle. If you run into trouble after that, research your error, if you can't find a solution, ask (a new question) about that specific problem. – geocodezip Jul 29 '19 at 20:49
  • if google isn't defined then how do I define it? – MarnieCMaclean Jul 30 '19 at 14:14
  • See my answer.. – geocodezip Jul 30 '19 at 14:18

1 Answers1

0
  1. you have errors in how you are including the Google Maps Javascript API and the Charts loader (in the fiddle):
<!-- Replace the value of the key parameter with your own API key. -->
<script async defer src="https://maps.googleapis.com/maps/api/js?key=AIzaSyCkUOdZ5y7hMm0yrcCQoCvLwzdM6M8s5qk&callback=initMap">

<script type="text/javascript" src="https://www.gstatic.com/charts/loader.js"></
</script>

should be:

<script type="text/javascript" src="https://www.gstatic.com/charts/loader.js"></script>
<!-- Replace the value of the key parameter with your own API key. -->
<script async defer src="https://maps.googleapis.com/maps/api/js?key=AIzaSyCkUOdZ5y7hMm0yrcCQoCvLwzdM6M8s5qk&callback=initMap"></script>

Notice that the Google Maps API v3 script include isn't terminated properly with </script> and the Charts loader include has an extra </. JavaScript is sensitive to these types of errors/typos.

I also re-ordered them to do the synchronous load of the charts loader first, then the asynchronous load of the Google Maps Javascript API v3.

  1. Once I fix that, I get another JavaScript error: Uncaught TypeError: Cannot read property 'InfoWindow' of undefined

Because that is used outside of the initMap function. You can't use any pieces of the Google Maps Javascript API v3 until it has loaded (when the initMap function runs).

  1. Once I fix that, I get another JavaScript error: Uncaught ReferenceError: initialize is not defined (because it isn't defined, the call can be removed).

  2. Then Uncaught (in promise) TypeError: Cannot read property 'BarChart' of undefined because the Charts API is being used before it is loaded.

  3. Then I get: Data column(s) for axis #0 cannot be of type string, because this is incorrect:

//set up data
var data = google.visualization.arrayToDataTable([
 ['Science Fiction', '55'],
 ['Comedy', '33'],
 ['Thriller', '21'],
 ['Action', '63'],
 ['Romance', '17'], 
  ]);

The second entry should be a number, and there needs to be a first row that is the labels (both strings). This works:

  //set up data
  var data = google.visualization.arrayToDataTable([
    ['Genre', '#'],
    ['Science Fiction', 55],
    ['Comedy', 33],
    ['Thriller', 21],
    ['Action', 63],
    ['Romance', 17],
  ]);

proof of concept fiddle (with one marker)

screenshot of resulting map

code snippet:

// Initialize and add the map
function initMap() {

  //The location of Inverness
  var inverness = {
    lat: 57.480819,
    lng: -4.224250
  };
  var city1 = {
    position: inverness
  };
  // The map, centered at Inverness
  var map = new google.maps.Map(
    document.getElementById('map'), {
      zoom: 4,
      center: inverness
    });

  //The location of Edinburgh
  var edinburgh = {
    lat: 55.959425,
    lng: -3.189161
  };
  var city4 = {
    position: edinburgh
  };
  // The marker, positioned at Edinburgh
  var marker4 = new google.maps.Marker({
    position: edinburgh,
    map: map,
    id: 'c4',
    title: 'Number Of Cinemas: 3'
  });


  google.charts.load('current', {
    packages: ['corechart']
  });

  function drawChart(map, marker) {
    //set up data
    var data = google.visualization.arrayToDataTable([
      ['Genre', '#'],
      ['Science Fiction', 55],
      ['Comedy', 33],
      ['Thriller', 21],
      ['Action', 63],
      ['Romance', 17],
    ]);

    //set up any options
    var options = {
      title: 'Film Genre Preferences'
    };

    //Create node
    var node = document.createElement('div'),
      infoWindow = new google.maps.InfoWindow(),
      chart = new google.visualization.BarChart(node);
    infoWindow.setContent(node);
    //check which marker it is
    if (marker.id == 'c4') {
      chart.draw(data, options);
    }
    return infoWindow;
  }
  google.maps.event.addListener(marker4, 'click', function(mouseclick) {
    var infoWindow = drawChart(map, this);
    infoWindow.open(map, marker4);
  });
  setTimeout(function() {
    google.maps.event.trigger(marker4, 'click');
  }, 1000);
}
/* Set the size of the div element that contains the map */

#map {
  height: 400px;
  /* The height is 400 pixels */
  width: 100%;
  /* The width is the width of the web page */
}
<!--The div element for the map -->
<div id="map"></div>
<script type="text/javascript" src="https://www.gstatic.com/charts/loader.js"></script>
<!-- Replace the value of the key parameter with your own API key. -->
<script async defer src="https://maps.googleapis.com/maps/api/js?key=AIzaSyCkUOdZ5y7hMm0yrcCQoCvLwzdM6M8s5qk&callback=initMap"></script>
geocodezip
  • 158,664
  • 13
  • 220
  • 245
  • I'm using your code but when I click the marker nothing happens (A bar chart doesn't appear) – MarnieCMaclean Jul 31 '19 at 14:28
  • Do the fiddle and the code snippet in my answer work for you? If so, you haven't incorporated all the fixes, how is the code you are using different? – geocodezip Jul 31 '19 at 14:34
  • Yeah your code snippet works but there's only the one marker showing up, in my code I have code for the 5 markers and the code for an infowindow chart for edinburgh but when I click on the edinburgh marker nothing happens. https://jsfiddle.net/MarnieMaclean/0rtkweo7/1/ – MarnieCMaclean Jul 31 '19 at 14:57
  • You only had data for one marker, it was hard to tell which marker had the infowindow and what to click on to open it (so it wasn't minimal). In your fiddle, the `drawChart` function should have a closing `}` after the `return infoWindow`. Then I get the error: `Uncaught Error: Row 0 has 2 columns, but must have 1` because the data in the `arrayToDataTable` call is incorrect (#5 in my answer). – geocodezip Jul 31 '19 at 16:14
  • I do have a } after return infoWindow? – MarnieCMaclean Jul 31 '19 at 21:57
  • I don't see one on line 67 of [your fiddle](https://jsfiddle.net/MarnieMaclean/0rtkweo7/1/). [Here is it fixed (again)](https://jsfiddle.net/geocodezip/ru1n9t4k/5/) – geocodezip Jul 31 '19 at 22:57
  • I appreciate your help but I need a chart to load when I click on all 5 markers and it's only working on one, any idea where I'm going wrong?? https://jsfiddle.net/MarnieMaclean/megx2cbo/20/ – MarnieCMaclean Aug 01 '19 at 16:05
  • That is a new question. Your original question only had data for a single marker. [Your latest fiddle](https://jsfiddle.net/MarnieMaclean/megx2cbo/20/) has a javascript error: `Uncaught ReferenceError: marker4 is not defined` – geocodezip Aug 01 '19 at 16:20
  • But in my question I clearly state that I have 5 markers and I need to display an infoWindow for each marker.. and it's only working for one marker but when I try and add data for an infowindow for another marker it doesn't work, do you know how to do this? – MarnieCMaclean Aug 01 '19 at 16:29
  • Your original question only had data for a single marker (and lots of issues preventing that from displaying). – geocodezip Aug 01 '19 at 17:22
  • I understand that but my point is if I can get an infowindow to work on one marker why won't it work on the rest? – MarnieCMaclean Aug 01 '19 at 21:51
  • I really need help with this, it's important. Its for uni – MarnieCMaclean Aug 01 '19 at 23:02
  • Ask a new question with data for more than one marker, that demonstrates your issue, preferably a [mcve] in the question itself. – geocodezip Aug 01 '19 at 23:19