0

If there are any similar questions with answers, please comment it down. So far, I have seen questions like this for Java but not Python after browsing.

I am trying to take the data from a messy file (with no headers), read and graph it. The important columns are #6 (for X-axis/Names), #19 (for Y-axis/Seconds) and #23 (For labels).

The Seconds column needs to be divided by 1000.

The data files are mixed by bunch of other notes. But, there is pattern in the data that I am trying to use to graph. The columns are separated by space. It starts with read seq and ends with either letter a, b, c, or d. Otherwise, that line is not the one I want to draw.

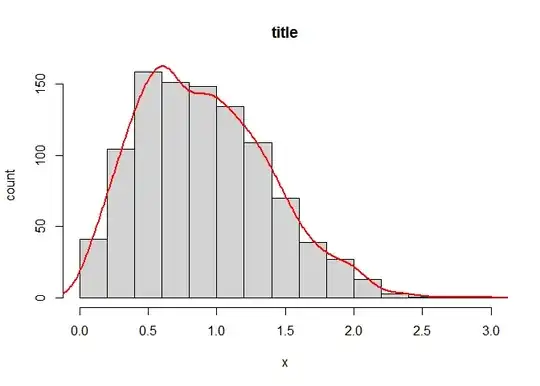
The sample graph would be like the following.

Note that the data does not have patter. as following for rest of the columns. I put c2.a, c3.z etc. as example so it would be easy to compare the columns while reading.

bunch of notes here
some data starts with read but does not end with a b c or d.
some of the data starts with read seq but does not end with a b c or d.

There can be empty lines and etc.
But the data itself is as below and has own patter with starts with "read seq" and 
ends with a b c or d
read seq c2.a c3.z c4.h c5.4 17 c7.g c8.g c9.5 c10.2 c11w2 c12k4 c13k7 c14s2 c15.5 c16.52 c17.aa c18.vs 3193.22 c20ag c21gd 1G-b
read seq c2.8 c3bg c4.6 c5.7 15 c7.f c8.d c9.i c10.i c11.t c12.r c13.y c14.h c15ef c16hf c17fg c18as 8640.80 c20da c21df 1G-c
read seq c2fd c3fd c4fd c5hf 1 c7jf c8ds c9vc c10vc c11hg c12.f c13hf c14gh c15po c16ss c17vb c18nv 12145.42 c20fs c21gd 1G-d
read seq c2gd c3dd c4gg c5as 5 c7gf c8jk c9gs c10pu c11zx c12fh c13ry c14.yu c15dg c16fs c17fs c18d 1192.15 c20xx c21gd 10G-a
read seq c2cx c3gd c4jg c5sd 18 c7hg c8kh c9xc c10yt c11xv c12uu c13re c14ur c15dg c16fa c17fs c18vd 12668.22 c20dg c21fs 1G-a
read seq c2cx c3dg c4gj c5df 11 c7jg c8kh c9gg c10re c11hf c12er c13ww c14rd c15df c16ff c17ff c18dv 10822.11 c20gd c21fs 10G-c

bunch of notes here as well.

Sample graph would be something like this: enter image description here
So far, I have the following:

import pandas as pd  

parser = argparse.ArgumentParser()
parser.add_argument('File', help="Enter the file name to graph it | At least one file is required to graph")

args=parser.parse_args()

file = args.file
file_1 = pd.read_csv(file, sep=" ", header=None)

Any help is appreciated.


EDIT 1: I coded as following but got the error below:

import pandas as pd
import seaborn as sns

df_dict = pd.read_csv('RESULTS-20190520')

df = pd.DataFrame(df_dict)
# Note that the 'read' and 'seq' values were imported as separate columns. 

# .loc selects rows where the first and second columns are 'read' and 'seq' respectively
# and where the final column has a string pattern ending with a|b|c|d. Note you can change the case argument if desired.
# Finally, we return only columns 6, 19, and 22 since that's all we care about.
df = df.loc[(df[0] == 'read') & (df[1] == 'seq') & df[22].str.match(pat=r'^.*a$|^.*b$|^.*c$|^.*d$', case=False), [6,19,22]]

# Rename vars and manipulate per edits
df['x'] = df[6]
# Divide y-var by 1000
df['y'] = df[19] / 1000 
# Use pandas' str.replace regex functionality to clean string column
df['cat'] = df[22].str.replace(pat=r'(\d+)(\D+)-(.*)', repl=r'\1-\3')

# This should be a lineplot, but as you didn't provide enough sample data, a scatterplot shows the concept. 
sns.lineplot(data=df, x='x', y='y', hue='cat', markers=True)

ERROR:

Traceback (most recent call last):
  File "C:\...\Python\lib\site-packages\pandas\core\indexes\base.py", line 2657, in get_loc
    return self._engine.get_loc(key)
  File "pandas\_libs\index.pyx", line 108, in pandas._libs.index.IndexEngine.get_loc
  File "pandas\_libs\index.pyx", line 132, in pandas._libs.index.IndexEngine.get_loc
  File "pandas\_libs\hashtable_class_helper.pxi", line 1601, in pandas._libs.hashtable.PyObjectHashTable.get_item
  File "pandas\_libs\hashtable_class_helper.pxi", line 1608, in pandas._libs.hashtable.PyObjectHashTable.get_item
KeyError: 0
During handling of the above exception, another exception occurred:

Traceback (most recent call last):
  File "C:\...\TEST1.py", line 12, in <module>
    df = df.iloc[(df[0] == 'read') & (df[1] == 'seq') & df[22].str.match(pat=r'^.*a$|^.*b$|^.*c$|^.*d$', case=False), [6,19,22]]
  File "C:\...\Python\lib\site-packages\pandas\core\frame.py", line 2927, in __getitem__
    indexer = self.columns.get_loc(key)
  File "C:\...\Python\lib\site-packages\pandas\core\indexes\base.py", line 2659, in get_loc
    return self._engine.get_loc(self._maybe_cast_indexer(key))
  File "pandas\_libs\index.pyx", line 108, in pandas._libs.index.IndexEngine.get_loc
  File "pandas\_libs\index.pyx", line 132, in pandas._libs.index.IndexEngine.get_loc
  File "pandas\_libs\hashtable_class_helper.pxi", line 1601, in pandas._libs.hashtable.PyObjectHashTable.get_item
  File "pandas\_libs\hashtable_class_helper.pxi", line 1608, in pandas._libs.hashtable.PyObjectHashTable.get_item
KeyError: 0
r_e
  • 242
  • 4
  • 14

1 Answers1

1

Starting with your sample data read in usingpd.read_clipboard(sep='\s', header=None) and saved using df.to_dict(), this seems to be (if I understand correctly) a fairly straightforward application of .loc with boolean conditions, and then plotting (here, seaborn is a good option as it provides a convenient hue parameter).

Setup

import pandas as pd
import seaborn as sns

df_dict = {0: {0: 'read', 1: 'read', 2: 'read', 3: 'read', 4: 'read', 5: 'read'},
 1: {0: 'seq', 1: 'seq', 2: 'seq', 3: 'seq', 4: 'seq', 5: 'seq'},
 2: {0: 'c2', 1: 'c2', 2: 'c2', 3: 'c2', 4: 'c2', 5: 'c2'},
 3: {0: 'c3', 1: 'c3', 2: 'c3', 3: 'c3', 4: 'c3', 5: 'c3'},
 4: {0: 'c4', 1: 'c4', 2: 'c4', 3: 'c4', 4: 'c4', 5: 'c4'},
 5: {0: 'c5', 1: 'c5', 2: 'c5', 3: 'c5', 4: 'c5', 5: 'c5'},
 6: {0: 17, 1: 15, 2: 1, 3: 5, 4: 18, 5: 11},
 7: {0: 'c7', 1: 'c7', 2: 'c7', 3: 'c7', 4: 'c7', 5: 'c7'},
 8: {0: 'c8', 1: 'c8', 2: 'c8', 3: 'c8', 4: 'c8', 5: 'c8'},
 9: {0: 'c9', 1: 'c9', 2: 'c9', 3: 'c9', 4: 'c9', 5: 'c9'},
 10: {0: 'c10', 1: 'c10', 2: 'c10', 3: 'c10', 4: 'c10', 5: 'c10'},
 11: {0: 'c11', 1: 'c11', 2: 'c11', 3: 'c11', 4: 'c11', 5: 'c11'},
 12: {0: 'c12', 1: 'c12', 2: 'c12', 3: 'c12', 4: 'c12', 5: 'c12'},
 13: {0: 'c13', 1: 'c13', 2: 'c13', 3: 'c13', 4: 'c13', 5: 'c13'},
 14: {0: 'c14', 1: 'c14', 2: 'c14', 3: 'c14', 4: 'c14', 5: 'c14'},
 15: {0: 'c15', 1: 'c15', 2: 'c15', 3: 'c15', 4: 'c15', 5: 'c15'},
 16: {0: 'c16', 1: 'c16', 2: 'c16', 3: 'c16', 4: 'c16', 5: 'c16'},
 17: {0: 'c17', 1: 'c17', 2: 'c17', 3: 'c17', 4: 'c17', 5: 'c17'},
 18: {0: 'c18', 1: 'c18', 2: 'c18', 3: 'c18', 4: 'c18', 5: 'c18'},
 19: {0: 3193.22, 1: 864.8, 2: 1214.42, 3: 1192.15, 4: 1866.22, 5: 2822.11},
 20: {0: 'c20', 1: 'c20', 2: 'c20', 3: 'c20', 4: 'c20', 5: 'c20'},
 21: {0: 'c21', 1: 'c21', 2: 'c21', 3: 'c21', 4: 'c21', 5: 'c21'},
 22: {0: '1G-b', 1: '1G-c', 2: '1G-d', 3: '10G-a', 4: '1G-a', 5: '10G-c'}}

df = pd.DataFrame(df_dict)
# Note that the 'read' and 'seq' values were imported as separate columns. 

Use .loc and .str.match()` to filter records, then plot

# .loc selects rows where the first and second columns are 'read' and 'seq' respectively
# and where the final column has a string pattern ending with a|b|c|d. Note you can change the case argument if desired.
# Finally, we return only columns 6, 19, and 22 since that's all we care about.
df = df.loc[(df[0] == 'read') & (df[1] == 'seq') 
            & df[22].str.match(pat=r'^.*a$|^.*b$|^.*c$|^.*d$', case=False), 
            [6,19,22]]

# Rename vars and manipulate per edits
df['x'] = df[6]
# Divide y-var by 1000
df['y'] = df[19] / 1000 
# Use pandas' str.replace regex functionality to clean string column
df['cat'] = df[22].str.replace(pat=r'(\d+)(\D+)-(.*)', repl=r'\1-\3')

# This should be a lineplot, but as you didn't provide enough sample data, a scatterplot shows the concept. 
sns.scatterplot(data=df, x='x', y='y', hue='cat')

scatter

Brendan
  • 3,901
  • 15
  • 23
  • Hello @Brendan. Thanks for the answer. I just realized that the data is not similar to the original. I made it mistake by labeling the columns as c2, c3, c4...etc. In each line/row, those data are different. I am going to update the data right now. How do i need to change it so it would work for the different data in each column? Thanks – r_e Jul 17 '19 at 14:37
  • Also, I want to read it automatically, instead of copy/pasting - hardcoding it to the PY code since there are a lot of data in the txt file. Any recommendations? – r_e Jul 17 '19 at 14:49
  • I don't think your updated data makes any difference. You're still selecting the same columns by number, correct? You may have to tweak slightly for your code when working with the raw file rather than sample data, but I don't see a difference, as we're just manually 'slicing away' everything that's not in columns 6, 19, or 22. – Brendan Jul 17 '19 at 14:53
  • @r_e Regarding your second comment, you certainly don't want to copy and paste data. That's a consequence of working with sample data as you provided on SO. For working with a real text file, look into [`pd.read_csv`](https://pandas.pydata.org/pandas-docs/stable/reference/api/pandas.read_csv.html) with its delimiter and header options. – Brendan Jul 17 '19 at 14:54
  • Yes, that's right, it would work since I am trying to "slice away" everything but columns #6,19,22. There's one more thing. How can I specify that it's the data (as it starts with ```read``` and ends with ```a``` or ```b``` or ```c``` or ```d```.. The data has bunch of other notes within the file. Will I able to do that with ```pd.read_csv```? Updated the data again – r_e Jul 17 '19 at 14:58
  • @r_e: You can do this using other pandas features after reading in the data. I'll edit to make this a bit more clear as it's probably lost beneath the sample data. pandas' `.loc` feature slices both rows and columns, and you can feed it boolean conditions to specify only rows where the value in a column is equal to ..., etc. pandas also has regex functionality, so you can identify rows based on text patterns. – Brendan Jul 17 '19 at 15:02
  • Hi @Brendan, could you please check the error in the new edit in the post? I am not sure why I am receiving the error. Thanks – r_e Jul 17 '19 at 16:16
  • @r_e `pd.read_csv` returns a dataframe, so you don't need to define a dictionary and then create a dataframe yourself. Once again, this is only for making a MCVE for use here on SO. You should take a bit of time to just experiment with pandas and familiarize yourself with it before trying to tackle this task, as it's unlikely the code I posted will work for your actual dataset with absolutely no modifications (a challenge of working with sample data vs. actual data). – Brendan Jul 17 '19 at 16:21
  • can you please check my new 'question' thread? I still have the same question but have done some improvements:https://stackoverflow.com/questions/57117485/how-to-label-line-chart-with-column-from-pandas-dataframe-from-3rd-column-value – r_e Jul 22 '19 at 13:53
  • @r_e Did this answer help with the question posed here? If so, it would be polite to accept it. I'll take a look at your new question when I have a moment, though I'm sure others will as well. – Brendan Jul 22 '19 at 14:25
  • yes it helped me to know about .loc so I searched it up a little more and changed my code accordingly. Thank you – r_e Jul 22 '19 at 14:40