4

I have created two metrics (m1 and m2) on my logs which will give me sum of some filter pattern, I wanted to add math expression in metric to sum these two metrics so I have added SUM([m1,m2]) but it is not giving me actual sum, Please refer below snapshot.

Snapshot of metrics and expression

I tried to add expressions as m1+m2 but still no luck. One thing I tried, m1 + 2 is giving me exact sum as 5. Not sure if anything is missing here.

Update (2019-07-18):

Adding stacked snapshot,
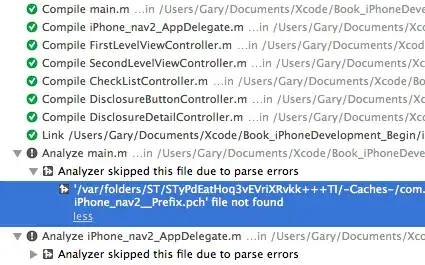
Stacked Image

Shawn
  • 537
  • 3
  • 7
  • 16
  • Can you remove the expression and change the widget type to `Stacked area` and add that screenshot to the question? Could give us more hints. Also, which setting do you have for the Number widget, `Latest value` or `Time range value`? – Dejan Peretin Jul 17 '19 at 20:07
  • @UnkindnessofDatapoints I have changed widget type to `Stacked Area` and added screenshot to question. For number widget, I had `Latest value` setting. – Shawn Jul 18 '19 at 05:35

1 Answers1

4

The SUM() functions sums up values per datapoint. On your last datapoints you have the value 2 for Completed and no value for Failed, so the sum is 2 + 0 = 2. Number widget on the other hand displays the last value returned which for Failed count is 3, but that 3 didn't happen at the last observed time period, it happened before.

You can do few thing here:

  • Update the metric filter on the logs to emit the value 0 as default if no Failed events are encountered.
  • Add a new expression to your graph, FILL(m1, 0), with ID e3 for example, which will give you a continuous line with zeros when there are no failures and the number of failures otherwise. Then you can update your SUM expression to be SUM([m2, e3]).

You can do this on both or your metrics, so you don't have gaps in any of them. This will make the graphing and alarming more consistent and intuitive.

Dejan Peretin
  • 10,891
  • 1
  • 45
  • 54