1

I'm using RRDtool to greate graphs.

Now, this command:

rrdtool graph temp.png \
    -w 600 -h 200 \
    --zoom 1 \
    --title "last 24 hours temperature" \
    --vertical-label "temperature (°C)" \
    --alt-autoscale \
    --alt-y-grid \
    --start end-1d \
    --force-rules-legend \
    --legend-position=south \
    --rigid \
    --slope-mode \
    --font "DEFAULT:12:century schoolbook l" --watermark "$(date '+%F %T %Z')" \
    DEF:temperature=temp.rrd:temp:AVERAGE \
    GPRINT:temperature:LAST:"Current temp.\: %.2lf°C\r" \
    LINE1:temperature\#007070:"Mainboard\l"

Gives me this image:

Mainboard temperature

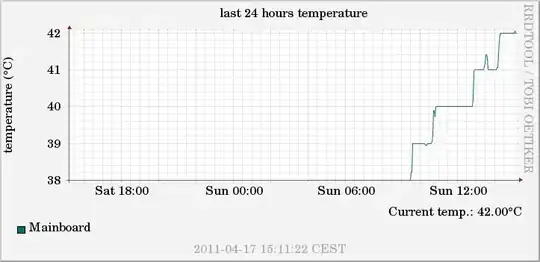
As you can see, the legend and the text "Current temp.: 42.00°C", do not appear on the same height (baseline).

How can I make those kind of lines appear next to each other, one left floated, the other right floated?

polemon
  • 4,722
  • 3
  • 37
  • 48

1 Answers1

2

You could try ...

rrdtool graph temp.png \
    -w 600 -h 200 \
    --zoom 1 \
    --title "last 24 hours temperature" \
    --vertical-label "temperature (°C)" \
    --alt-autoscale \
    --alt-y-grid \
    --start end-1d \
    --force-rules-legend \
    --legend-position=south \
    --rigid \
    --slope-mode \
    --font "DEFAULT:12:century schoolbook l" --watermark "$(date '+%F %T %Z')" \
    DEF:temperature=temp.rrd:temp:AVERAGE \
    LINE1:temperature\#007070:"Mainboard" \
    GPRINT:temperature:LAST:"Current temp.\: %.2lf°C\j"

note that I flipped the last two lines around and added \j

Tobi Oetiker
  • 5,167
  • 2
  • 17
  • 23