0

I am using this lib chart : https://github.com/danielgindi/Charts

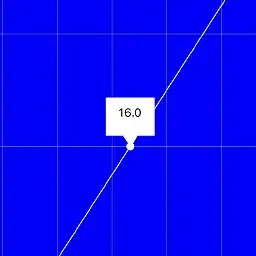
I have one line chart. Which will display values on x axis. But now it's showing in decimal like 22.0. But i want like 22

Here is my code :

func updateGraphMaster(xAxisLabel: String) {
    var lineChartEntry = [ChartDataEntry]()
    for num in 0..<chartDataDoubles.count {
        let value = ChartDataEntry(x: Double(num), y: chartDataDoubles[num])
        lineChartEntry.append(value)
    }

    let lineChartDataSet = LineChartDataSet(entries: lineChartEntry, label: xAxisLabel)

    lineChartDataSet.colors = [NSUIColor.white]

    lineChartDataSet.highlightEnabled = true
    lineChartDataSet.highlightColor = UIColor.white
    lineChartDataSet.drawVerticalHighlightIndicatorEnabled = false
    lineChartDataSet.drawHorizontalHighlightIndicatorEnabled = false
    lineChartDataSet.drawValuesEnabled = true
    lineChartDataSet.drawCirclesEnabled = false
    lineChartDataSet.drawCircleHoleEnabled = false

    let gradient = getGradientFilling()
    lineChartDataSet.fill = Fill.fillWithLinearGradient(gradient, angle: 90.0)
    lineChartDataSet.drawFilledEnabled = true

    let data = LineChartData()
    data.addDataSet(lineChartDataSet)
    data.setDrawValues(false)
    data.setValueTextColor(NSUIColor.white)


    let formatter = NumberFormatter()
    formatter.maximumFractionDigits = 0
    formatter.numberStyle = .none
    formatter.locale = .current
    //lineChartDataSet.valueFormatter = DefaultValueFormatter(formatter: formatter)

    data.setValueFormatter(DefaultValueFormatter(formatter: formatter))

    chartView.data = data
    chartView.xAxis.valueFormatter = DefaultAxisValueFormatter(formatter: formatter)

}

Here i using setValueFormatter and append the data to chart view. But still it's showing in decimal . Not in integer.
Sai Kumar
  • 67
  • 1
  • 1
  • 7
  • You need to apply formatter to axis not the data. Check this out: https://stackoverflow.com/questions/31318858/ios-charts-float-to-integer-yaxis – Amir Sk Jun 20 '19 at 21:14
  • 1
    You need to apply formatter to axis not the data. Check this out: https://stackoverflow.com/questions/31318858/ios-charts-float-to-integer-yaxis – Amir Sk Jun 20 '19 at 21:16

3 Answers3

1

if you want to edit the data set value format itself not the axis, try this:

        data.valueFormatter = DefaultValueFormatter(decimals: 0)

I hope It works!

It seems that you have more than 1 data set to show on chart?

Amir Sk
  • 158
  • 9
  • i added , but its throws me some error. Line chart dont have any y axis.Then i change it to x-axis. It force me to add`as! IAxisValueFormatter`Then i got error in second line `Value of type 'IAxisValueFormatter?' has no member 'minimumFractionDigits'`. I added in viewdidload – Sai Kumar Jun 21 '19 at 06:37
  • Actually i dont want in x-axis or y axis. Its bascially, in line chart when ever user click any node on their chart. The value marker will show that particular node value. In that values its coming as decimal – Sai Kumar Jun 21 '19 at 07:15
  • check my updated answer, let me know if it doesn't work. – Amir Sk Jun 21 '19 at 15:57
  • And I'm sorry about the yaxis. it actually have 2 y axis , so they are named leftaxis and rightaxis. – Amir Sk Jun 21 '19 at 16:13
0

You want to set formatter.maximumFractionDigits to zero.

Craig Siemens
  • 12,942
  • 1
  • 34
  • 51
0

Your question was unclear to me until you showed us a screenshot

You were not asking for the actual drawn values to be formatted, you were asking to format the value displayed by the label of the marker that appears when you click a point. For that implementation, I had to presume you used the custom class BalloonMarker from the Charts-Demo, which does not format the value of its text before being displayed. I was able to reproduce your issue and fix it: note the lines 184-187 of BalloonMarker.swift:

184  open override func refreshContent(entry: ChartDataEntry, highlight: Highlight)
185  {
186       setLabel(String(entry.y))
187  }

Line 186 needs to be replaced with

186       setLabel(String(format: "%.0f", entry.y))

That should fix your issue. I include my reproduction and fix for you below:

Reproduction of your issue

enter image description here

With Fix

enter image description here

Additionally, if you wish to ensure your x-axis shows only integers you need to do the following:

let formatter = NumberFormatter()
formatter.maximumFractionDigits = 0
formatter.numberStyle = .none
formatter.locale = .current
chartView.xAxis.valueFormatter = DefaultAxisValueFormatter(formatter: formatter)
rolling_codes
  • 15,174
  • 22
  • 76
  • 112
  • same i am getting decimal values. Its not changing – Sai Kumar Jun 21 '19 at 06:38
  • Actually i dont want in x-axis or y axis. Its bascially, in line chart when ever user click any node on their chart. The value marker will show that particular node value. In that values its coming as decimal – Sai Kumar Jun 21 '19 at 07:15
  • @SaiKumar Based on the wording of your question it seems you are trying to ensure display of integers on the x-axis. Can you please make this more clear by providing a screenshot indicating specifically what it is that is being displayed with decimal values but you would like to display as an integer? – rolling_codes Jun 21 '19 at 13:40
  • I have updated my code. i am using ur same code. Dont know what i ma missing. I needs to show like your line chart values like 6,16,26 like that. In my case its displaying as 6.0, 16.0, 26.0 – Sai Kumar Jun 21 '19 at 17:31
  • @SaiKumar updated the answer to include your runtime data points and screenshot again. Will you **please provide a screenshot** of your device/simulator? That would be immensely helpful. Also, where do you define `chartView` and what are its configurations? – rolling_codes Jun 21 '19 at 17:39
  • Is it possible you have code elsewhere that is overwriting the value formatter of your chartView's data variable? – rolling_codes Jun 21 '19 at 17:45
  • please find my class file : https://www.dropbox.com/s/kgr543hab05nhfb/KMChartsViewController.swift?dl=0 – Sai Kumar Jun 21 '19 at 18:25
  • You have the line values called `6, 16, 16` right. but as per my code it will diplay as `6.0, 16.0, 26.0`.This is what i needs to show as like youe solution image. But not able to get it. – Sai Kumar Jun 21 '19 at 18:26
  • @SaiKumar how are your point labels even being drawn when you have `data.setDrawValues(false)`? Try changing that to `data.setDrawValues(true)` – rolling_codes Jun 21 '19 at 18:40
  • Please check the image here : https://www.dropbox.com/s/kjs12e8f1zm7gjn/Screen%20Shot%202019-06-22%20at%2012.12.48%20AM.png?dl=0. it will display as `162.0`. But when i click my any point it will display the values. And the values i need it like `162`. Not as `162.0` – Sai Kumar Jun 21 '19 at 18:44
  • Initially, it wont show the values as default. if i click any point then only i needs t show the values. So only i seted to false – Sai Kumar Jun 21 '19 at 18:45
  • @SaiKumar where is your `BallonMarker` source code? – rolling_codes Jun 21 '19 at 18:54
  • that is an lib class. Not my own class.In that file you can find the method `setUpLineChartView`. in that ` let marker = BalloonMarker(color: UIColor.white,font: .systemFont(ofSize: 12), textColor: Utils.colorCode.memory_primary_dark, insets: UIEdgeInsets(top: 8, left: 8, bottom: 20, right: 8)) marker.chartView = chartView marker.minimumSize = CGSize(width: 50, height: 40) chartView.marker = marker chartView.reloadInputViews()` – Sai Kumar Jun 21 '19 at 19:03
  • Any possibilities for my issues ? – Sai Kumar Jun 21 '19 at 19:28
  • @SaiKumar the issue is in your `BalloonMarker` class. I will update my answer shortly – rolling_codes Jun 21 '19 at 20:28
  • @SaiKumar Great! Happy coding – rolling_codes Jun 24 '19 at 06:03
  • can u delete that image from ur answer. Bec its bit some privacy for my app. i can not suppose to show in any wr. SO only.And thanks for your help – Sai Kumar Jun 24 '19 at 06:03
  • @SaiKumar yes I can do that – rolling_codes Jun 24 '19 at 06:04