Exponential smoothing or exponential moving average will create the type of data you want. Ideally, you would have existing stock price data that represents the type of time series that you want to generate. You fit an exponential smoothing model to your data. This will determine a number of parameters for that model. You can then use the model and its parameters to generate similar time series with the same kind of trends, and you can control the volatility (standard deviation) of the random variable associated with the model.
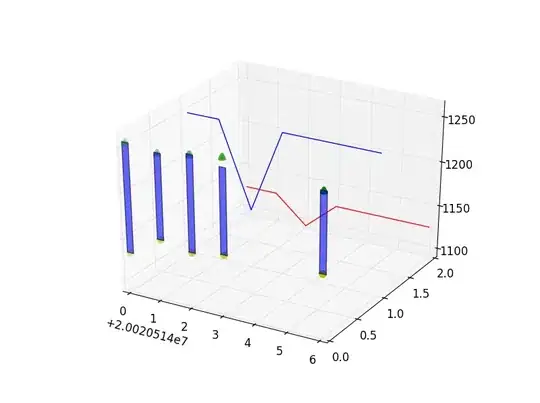
As an example of what you can do, in the image below the blue and yellow parts are from real data, and the green part is synthetic data generated with a model that was fit to the real data.

Time series forecasting is a large topic. I do not know how familiar you are with that topic. See Time Series Analysis, it covers a large range of time series providing clear presentations and examples in Excel. See exponential smoothing for more theoretical background
Here is a specific example of how such a time series can be generated. I chose one of the 30 exponential smoothing models, one that has additive trend and volatility, and no seasonal component. The equations for generating the time series are:
The time index is t, an integer. The values of the time series are yt. lt and bt are respectively the offset and slope components of the time series. Alpha and beta are parameters, and l-1 and b-1 are initial values of the offset and slope components. et is the value of a random variable that follows some distribution, e.g. normal. Alpha and beta must satisfy the relations below for stability of the time series.

To generate different time series you choose values for alpha, beta, l-1, b-1, and the standard deviation of et assuming a normal law, and calculate the successive values of yt. I have done this in Excel for several combinations of values. Here are several time series generated with this model. Sigma is the standard deviation (volatility) of et.

Here are the equations for the 30 models. N means no trend / seasonal component. A means additive component. M means multiplicative component. The d subscript indicates a variant that is damped. You can get all of the details from the references above.