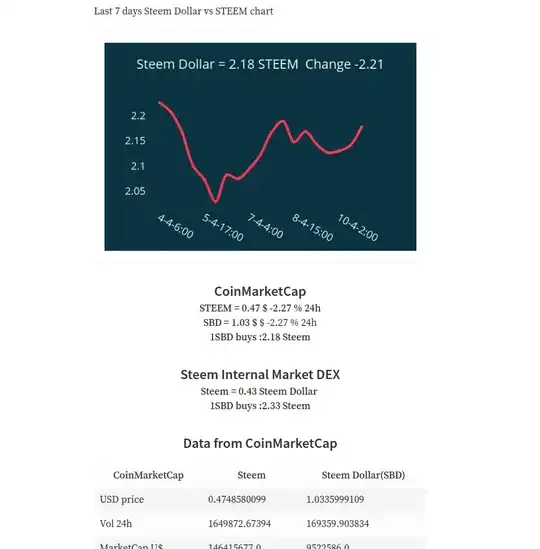
If you want to alter spacing between major axis ticks then you probably need to change MajorDelta value.
As I see you use CategoryDateAxis so you should be aware that this axis type is index based and it operates with indices instead of Dates. This means that if you have data where xData in unevenly spaced (e.g. distance in time between points is different ) then with type of xAxis on chart you'll see the same distance between points.
This also means that you'll need to specify MajorDelta as index interval and you can't specify time interval out of the box. To provide desired output you'll need to calculate how many data points lies within desired time span. For example if your data contains points with interval 15 min then to draw major tick every 4 hours like on screenshot you'll need to set MajorDelta = 16 ( 15min * 16 = 4 hours ) but as I said it depends on data set which you're trying to display.

