I have two datasets: one of GPS points (from bus locations) with timestamps that are collected mostly at every 30 seconds, and other of intermediate points (from bus stops) that fall within the GPS trajectory.
# GPS Points
gps_points <- structure(list(id_gps = c(4138176L, 4136334L, 4134534L, 4132685L,
4130891L, 4129035L, 4127232L, 4125387L, 4123620L, 4121861L, 4120114L,
4118381L, 4116721L, 3380373L, 3374532L, 3369036L, 3363258L, 3357540L,
3351543L, 3345549L, 3339777L, 3333210L, 3326793L, 3319251L, 3312822L,
3306501L), hora = structure(c(1535953786, 1535953816, 1535953846,
1535953876, 1535953906, 1535953936, 1535953966, 1535953996, 1535954026,
1535954056, 1535954086, 1535954116, 1535954146, 1535954176, 1535954206,
1535954236, 1535954266, 1535954296, 1535954326, 1535954356, 1535954386,
1535954416, 1535954446, 1535954476, 1535954506, 1535954536), class = c("POSIXct",
"POSIXt"), tzone = "UTC"), lon = c(-38.500763, -38.501413, -38.50252,
-38.503505, -38.504694, -38.505441, -38.506651, -38.507328, -38.507965,
-38.509063, -38.509735, -38.51022, -38.511546, -38.511778, -38.512788,
-38.513633, -38.514568, -38.51495, -38.515331, -38.515878, -38.516438,
-38.516628, -38.517129, -38.517651, -38.518056, -38.518358),
    lat = c(-3.80892, -3.807633, -3.805113, -3.802854, -3.800343,
    -3.79881, -3.796178, -3.79474, -3.793426, -3.791048, -3.789561,
    -3.78856, -3.78569, -3.785216, -3.783108, -3.781245, -3.778751,
    -3.777118, -3.775673, -3.773774, -3.771845, -3.771159, -3.769336,
    -3.767198, -3.765478, -3.764019)), row.names = c(NA, -26L
), class = "data.frame", .Names = c("id_gps", "hora", "lon",
"lat"))


# Stops
stops <- structure(list(stop_id = c(4873, 3215, 5083, 3346, 3363, 3362,
3542, 3543, 3540, 4629, 3528), lon = c(-38.516766, -38.515311,
-38.513903, -38.512154, -38.511001, -38.509844, -38.508943, -38.50816,
-38.507062, -38.505798, -38.504044), lat = c(-3.771828, -3.77695,
-3.781432, -3.785157, -3.787631, -3.790069, -3.791997, -3.793663,
-3.796027, -3.798711, -3.802504)), class = c("tbl_df", "tbl",
"data.frame"), row.names = c(NA, -11L), .Names = c("stop_id",
"lon", "lat"))
head(gps_points)
 id_gps                hora       lon       lat
1 4138176 2018-09-03 05:49:46 -38.50076 -3.808920
2 4136334 2018-09-03 05:50:16 -38.50141 -3.807633
3 4134534 2018-09-03 05:50:46 -38.50252 -3.805113
4 4132685 2018-09-03 05:51:16 -38.50350 -3.802854
5 4130891 2018-09-03 05:51:46 -38.50469 -3.800343
6 4129035 2018-09-03 05:52:16 -38.50544 -3.798810

head(stops)
stop_id       lon       lat
1    4873 -38.51677 -3.771828
2    3215 -38.51531 -3.776950
3    5083 -38.51390 -3.781432
4    3346 -38.51215 -3.785157
5    3363 -38.51100 -3.787631
6    3362 -38.50984 -3.790069
GPS points in red, stops in blue
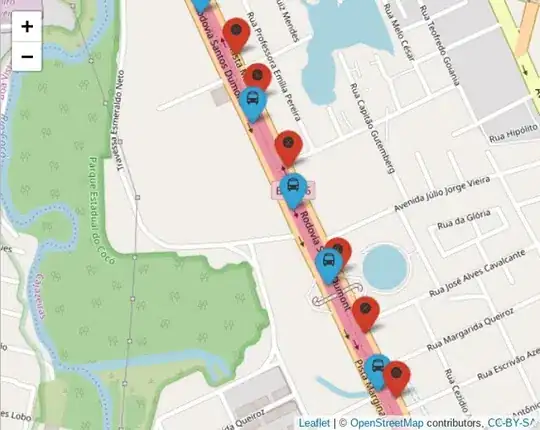
I want to estimate (through linear interpolation on the GPS dataset) the timestamp estimated associated with each stop using R. The desired output would be the stops dataset with a new column identifying the interpolated timestamp.
The workaround I'm doing right now includes interpolating the GPS points to occurrences every 5 seconds (using this method), then calculating the closest GPS occurrence at each stop (using RANN::nn2). The GPS dataset is very big, so this is computationally infeasible, and I still don't get the "exact" timestamp associated with each stop.
# workaround
# Crete combination of timestamps for each 5 seconds
full.time   <- with(gps_points,seq(gps_points$hora[1],tail(gps_points$hora,1),by=5))

library(zoo)
# convert to zoo object
df.zoo <- zoo(gps_points[,c("lon", "lat")],gps_points$hora)

# interpolate; result is also a zoo object
result <- na.approx(df.zoo,xout=full.time)

# transform zoo to df
zoo.to.data.frame <- function(x, index.name="hora") {
  stopifnot(is.zoo(x))
  xn <- if(is.null(dim(x))) deparse(substitute(x)) else colnames(x)
  setNames(data.frame(index(x), x, row.names=NULL), c(index.name,xn))
}

gps_points_interpolated <- zoo.to.data.frame(result) %>% as_tibble()

# Create temp_id for stops
stops <- stops %>%
  mutate(temp_id = 1:n())

# To each GPS point, what's the closest stop?
opa <- RANN::nn2(select(stops, lon, lat), select(gps_points_interpolated, lon, lat), 1)

vamos <- gps_points_interpolated %>%
  mutate(temp_id = opa$nn.idx, dist = opa$nn.dists*111320)

# Bring back stop_id, lon e lat of each stop
vamos <- left_join(vamos, stops, by = "temp_id", suffix = c(".gps", ".stop")) %>%
# Select columns
  select(stop_id, lon = lon.stop, lat = lat.stop, hora, dist)

# Select the observations that have minimun distance to each stop
vamos_fim <- vamos %>%
  group_by(stop_id) %>%
  slice(which.min(dist))

head(vamos_fim)
# A tibble: 6 x 5
# Groups:   stop_id [6]
  stop_id   lon   lat hora                dist[,1]
    <dbl> <dbl> <dbl> <dttm>                 <dbl>
1    3215 -38.5 -3.78 2018-09-03 05:58:21     34.1
2    3346 -38.5 -3.79 2018-09-03 05:56:21     39.9
3    3362 -38.5 -3.79 2018-09-03 05:54:36     37.1
4    3363 -38.5 -3.79 2018-09-03 05:55:26     37.9
5    3528 -38.5 -3.80 2018-09-03 05:51:21     38.7
6    3540 -38.5 -3.80 2018-09-03 05:52:51     34.6
Methods other than linear interpolation would be welcome as well. Thanks.