I'm trying to generate a stacked line/area graph utilizing the ggplot and geom_area functions. I have my data loaded into R correctly from what I can tell. Every time I generate the plot, the graph is empty (even though the axis looks correct except for the months being organized in alpha).
I've tried utilizing the data.frame function to define my variables but was unable to generate my plot. I've also looked around Stack Overflow and other websites, but no one seems to have the issue of no errors but still an empty plot.
Here's my data set:

Here's the code I'm using currently:
ggplot(OHV, aes(x=Month)) +
  geom_area(aes(y=A+B+Unknown, fill="A")) +
  geom_area(aes(y=B, fill="B")) +
  geom_area(aes(y=Unknown, fill="Unknown"))
Here's the output at the end:
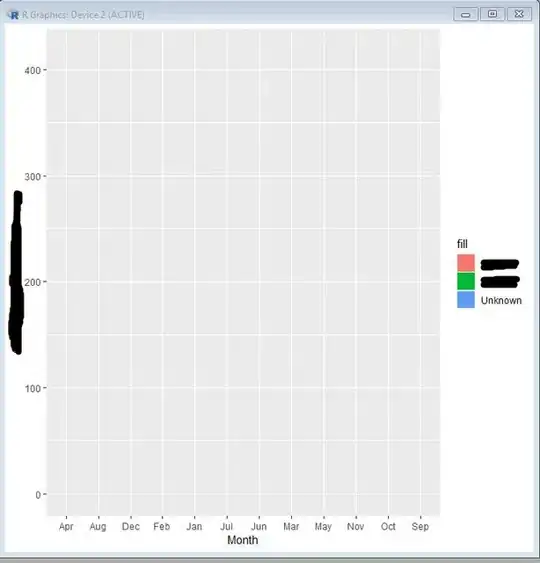
I have zero error messages, simply just no data being plotted on my graph.

