2

I can't get variable labels do not overlap with ggbiplot

(using RStudio 1.1.463 and R version 3.5.3)

I am running a pca with prcomp but i get this kind of variable label overlapping: enter image description here
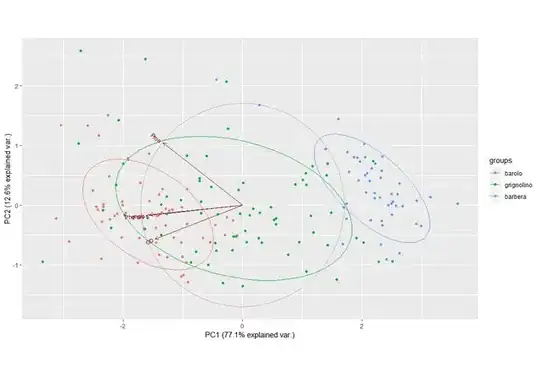
Here is an example:

library(ggbiplot)
data(wine)
wine_subset<-subset(wine[,c(6:7,9,12)])
wine.pca <- prcomp(wine_subset, scale. = TRUE)
print(ggbiplot(wine.pca, obs.scale = 1, var.scale = 1, groups = wine.class, ellipse = TRUE, circle = TRUE))

I tried to solve adding this code from ggrepel package:

library(ggrepel)
+geom_text_repel(aes(labels=colnames(wine_subset)))

but it returns the following error:

Warning: Ignoring unknown aesthetics: labels Error: Aesthetics must be either length 1 or the same as the data (178): labels

It seems to me that it is trying to take the row labels, but I don't need them in the plot. I need the variable labels only.
Facu
  • 101
  • 6
  • 1
    There are a few issues here: `geom_text_repel()` is designed to address overlapping labels, which I don't see here. Also I don't see how that function would work with a specialized plot like `ggbiplot()` since you don't have access to the `x` and `y` coordinates that you need to specify in `geom_text_repel()`. Finally, you can't set a `ggplot2` mapping to a vector; it has to be a column of your dataset. If you're concerned about the labels overlapping the points, you might want to consider setting an alpha to make the points more transparent. – jtr13 May 17 '19 at 11:03
  • 1
    Thanks for your reply. The overlapping problem is with the variables labels. I don't need the row labels in the plot. – Facu May 17 '19 at 11:22
  • Sorry, I see the problem now. This is a hack but it works: `colnames(wine_subset)[2] <- "\nFlav"` – jtr13 May 17 '19 at 11:31
  • Thanks! could you please paste with the full code? I don't get how to use your suggestion – Facu May 17 '19 at 11:57
  • Sure, see below. – jtr13 May 17 '19 at 13:30

2 Answers2

0

This is a hack which adds a line break to one of the variable names so it doesn't overlap with another:

library(ggbiplot)
data(wine)
wine_subset<-subset(wine[,c(6:7,9,12)])
colnames(wine_subset)[2] <- "\nFlav"  # new line
wine.pca <- prcomp(wine_subset, scale. = TRUE)
print(ggbiplot(wine.pca, obs.scale = 1, var.scale = 1, groups = wine.class, ellipse = TRUE, circle = TRUE))

Just be sure to only use the new column name for plotting.

enter image description here

jtr13
  • 1,225
  • 11
  • 25
0

I have found a better solution with ggfortify package, which has a straightforward parameter loadings.label.repel:

library(ggbiplot)   #just for using the same example database as before
library(ggfortify)

data(wine)

wine_subset<-subset(wine[,c(6:7,9,12)])

wine.pca <- prcomp(wine_subset, scale. = TRUE)

wine$wine.class <- wine.class    #adding wine classes to wine data frame

autoplot(wine.pca, data=wine, colour="wine.class", loadings = TRUE, loadings.colour = 'brown',
         loadings.label.colour='brown', loadings.label = TRUE, loadings.label.size = 4,
         loadings.label.repel=TRUE)+stat_ellipse(type = "norm", 
         level=0.68,aes(color=wine.class))

Resulting plot: enter image description here

Facu
  • 101
  • 6