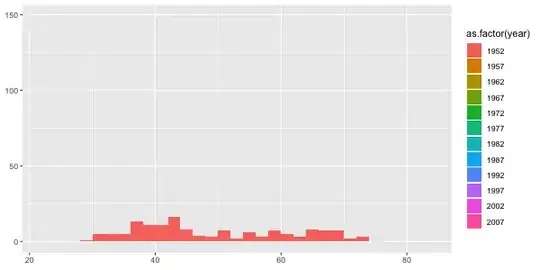
I'm trying to show a histogram building over time. It would start with, say, 1952 data, then each year update the histogram, growing.
The path seems to be gganimate, and I would think using transition_reveal to slowly reveal more data over time. This does not appear to work.
Let's say I start with this:
library(gapminder)
library(tidyverse)
library(gganimate)

ggplot(gapminder,
       aes(lifeExp, fill = fct_rev(factor(year)), group = fct_rev(factor(year)))) +
  geom_histogram(position = "stack", bins = 20) +
  transition_reveal(year)
which fails badly.
I can sort of kludge things together with transition_layer, like so:
ggplot(gapminder, aes(lifeExp, fill = fct_rev(factor(year)))) +
  geom_histogram(position = "stack", bins = 20,
                 data = filter(gapminder, year<= 1952)) +
  geom_histogram(position = "stack", bins = 20,
                 data = filter(gapminder, year<= 1957)) +
  geom_histogram(position = "stack", bins = 20,
                 data = filter(gapminder, year<= 1962)) +
  geom_histogram(position = "stack", bins = 20,
                 data = filter(gapminder, year<= 1967)) +
  geom_histogram(position = "stack", bins = 20,
                 data = filter(gapminder, year<= 1972)) +
  geom_histogram(position = "stack", bins = 20,
                 data = filter(gapminder, year<= 1977)) +
  transition_layers()
which produces the desired result, but is unwieldy. Is there a more portable way?
Here is a gif of what I'm looking for:

