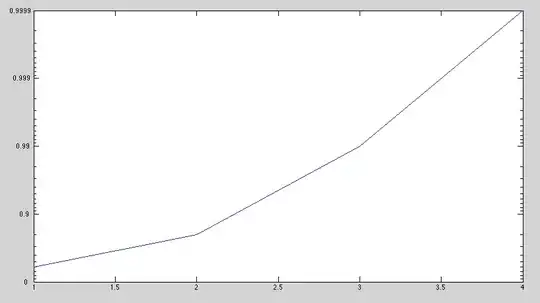
I am creating a line graph using pygal by passing in an array of numbers to be graphed. I am wishing for the points marked on the graph to change color when they are in/outside of a certain range. I.e. If there is a point logged over 40, color it red, if there is a point logged under 20, color it blue.
There does not seem to be an easy way to loop through the array and draw a single point.
The graph is being made with the following code:
    customStyle = Style(colors=["#000000"])
    chart = pygal.Line(style=customStyle)
    chart.title = 'Browser usage evolution (in %)'
    chart.x_labels = recordedDates
    chart.add('Humidity', recordedHumidity)
    chart.render_to_png("out.png")
I would like to have all points above 40 red and below 20 blue.
