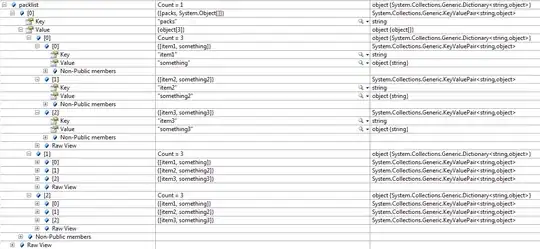
I looked at this SO question, that SO question. I followed this github method check out ISSUES to help get ideas on how to solve this.
Step 1: Copy the following into text editor and save as test.csv file:
My datasource is NVD JSON FEEDS which I processed and cleaned and created this dataset with the first 25 rows shown here.
Year,Vendor name,Product name,CVE,Major,Minor,Build,Revision
1988,eric_allman,sendmail,CVE-1999-0095,5,5.58,,
1988,ftp,ftp,CVE-1999-0082,*,,,
1988,ftpcd,ftpcd,CVE-1999-0082,*,,,
1989,bsd,bsd,CVE-1999-1471,4,4.2,,
1989,bsd,bsd,CVE-1999-1471,4,4.3,,
1989,sun,sunos,CVE-1999-1122,4,4.0,,
1989,sun,sunos,CVE-1999-1122,4,4.0,4.0.1,
1989,sun,sunos,CVE-1999-1122,4,4.0,4.0.3,
1989,sun,sunos,CVE-1999-1467,4,4.0,,
1989,sun,sunos,CVE-1999-1467,4,4.0,4.0.1,
1989,sun,sunos,CVE-1999-1467,4,4.0,4.0.2,
1989,sun,sunos,CVE-1999-1467,4,4.0,4.0.3,
1989,sun,sunos,CVE-1999-1467,4,4.0,4.0.3c,
1990,digital,vms,CVE-1999-1057,5,5.3,,
1990,freebsd,freebsd,CVE-2000-0388,3,3.0,,
1990,freebsd,freebsd,CVE-2000-0388,3,3.1,,
1990,freebsd,freebsd,CVE-2000-0388,3,3.2,,
1990,freebsd,freebsd,CVE-2000-0388,3,3.3,,
1990,freebsd,freebsd,CVE-2000-0388,3,3.4,,
1990,hp,apollo_domain_os,CVE-1999-1115,sr10,sr10.2,,
1990,hp,apollo_domain_os,CVE-1999-1115,sr10,sr10.3,,
1990,next,nex,CVE-1999-1392,1,1.0a,,
1990,next,next,CVE-1999-1198,2,2.0,,
1990,next,next,CVE-1999-1391,1,1.0,,
1990,next,next,CVE-1999-1391,1,1.0a,,
Step 2: Copy and paste following code into R and run it:
My codes follow this SO question especially the discussion by @NinjaElvis. I think it is possible to create 3 levels or more. Just doing more research and figuring out.
############################
suppressPackageStartupMessages(library("highcharter"))
library("dplyr")
library("purrr")
library("data.table")

second_el_to_numeric <- function(ls){

  map(ls, function(x){
    x[[2]] <- as.numeric(x[[2]])
    x
  })

}

cve_affected_product <- fread("test.csv")

# LAYER ONE YEAR DRILLDOWN VIEW #########################
Year <- cve_affected_product[,c(1:2)]
Year <- unique(Year[,list(Year,`Vendor name`)])
Year <- Year[,c(1)][,count:=1]
Year <- setDT(aggregate(.~ Year ,data=Year,FUN=sum))
#setorder(Year, Year, `Vendor name`)
years_df <- tibble(
  name = c(Year$Year),
  y = c(Year$count),
  drilldown = tolower(paste(name,'id'))
)

ds <- list_parse(years_df)
names(ds) <- NULL

# Vendor View HC ###########
hc <- highchart() %>%
  hc_chart(type = "column") %>%
  hc_title(text = "Basic drilldown") %>%
  hc_xAxis(type = "category") %>%
  hc_yAxis(visible = FALSE,reversed = FALSE) %>%
  hc_legend(enabled = FALSE) %>%
  hc_plotOptions(
    series = list(
      boderWidth = 0,
      dataLabels = list(enabled = TRUE)
    )
  ) %>%
  hc_add_series(
    name = "Vendors",
    colorByPoint = TRUE,
    data = ds
  )


# LAYER TWO VENDOR DRILLDOWN VIEW #########################
Vendor <- cve_affected_product[,c(1:3)]
Vendor <- unique(Vendor[,list(Year,`Vendor name`,`Product name`)])
Vendor <- Vendor[,c(1:2)][,count:=1]
Vendor <- setDT(aggregate(.~ Year+`Vendor name` ,data=Vendor,FUN=sum))
setorder(Vendor, Year, `Vendor name`)

years <- as.character(unique(Vendor$Year))

for(i in 1:length(years)){
  tempdf <- Vendor[Vendor$Year==years[i],]
  dfname <- paste("df",years[i],sep="")
  dsname <- paste("ds",years[i],sep="")

  X <- tibble(
    name = c(tempdf$`Vendor name`),
    y = c(tempdf$count),
    drilldown = tolower(paste(name,'id'))
  )


  Y <- second_el_to_numeric(list_parse2(assign(dfname,X)))

  assign(dsname,Y)


}


# Vendor View HC ###########
hc <- hc %>%
  hc_drilldown(
    allowPointDrilldown = TRUE,
    series = list(
      list(
        id = "1988 id",
        data = ds1988,
        colorByPoint = TRUE,
        keys = list('name','y','drilldown')
      ),
      list(
        id = "1989 id",
        data = ds1989,
        keys = list('name','y','drilldown')
      ),
      list(
        id = "1990 id",
        data = ds1990,
        keys = list('name','y','drilldown')
      )#,
    )
  )

# LAYER THREE PRODUCT DRILLDOWN VIEW #########################
Product <- cve_affected_product[,c(1:4)]
Product <- unique(Product[,list(Year,`Vendor name`,`Product name`, CVE)])
Product <- Product[,c(1:3)][,count:=1]
Product <- setDT(aggregate(.~ Year+`Vendor name`+`Product name` ,data=Product,FUN=sum))
setorder(Product, Year, `Vendor name`,`Product name`)

vendors <- as.character(unique(Product$`Vendor name`))

for(i in 1:length(vendors)){
  tempdf <- Product[Product$`Vendor name`==vendors[i],]
  dfname <- paste("df",vendors[i],sep="")
  dsname <- paste("ds",vendors[i],sep="")

  X <- tibble(
    name = c(tempdf$`Product name`),
    y = c(tempdf$count),
    drilldown = tolower(paste(name,'id'))
  )


  Y <- second_el_to_numeric(list_parse2(assign(dfname,X)))

  assign(dsname,Y)

}
# Product View HC ###########
hc <- hc %>%
  hc_drilldown(
    allowPointDrilldown = TRUE,
    series = list(
      list(
        id = "eric_allman id",
        data = dseric_allman,
        keys = list('name','y','drilldown')
      ),
      list(
        id = "ftp id",
        data = dsftp,
        keys = list('name','y','drilldown')
      ),
      list(
        id = "ftpcd id",
        data = dsftpcd,
        keys = list('name','y','drilldown')
      ),
      list(
        id = "bsd id",
        data = dsbsd,
        keys = list('name','y','drilldown')
      ),
      list(
        id = "sun id",
        data = dssun,
        keys = list('name','y','drilldown')
      ),
      list(
        id = "digital id",
        data = dsdigital,
        keys = list('name','y','drilldown')
      ),
      list(
        id = "freebsd id",
        data = dsfreebsd,
        keys = list('name','y','drilldown')
      ),
      list(
        id = "hp id",
        data = dshp,
        keys = list('name','y','drilldown')
      ),
      list(
        id = "next id",
        data = dsnext,
        keys = list('name','y','drilldown')
      )#,
    )
  )

# LAYER FOUR CVE DRILLDOWN VIEW #########################
Product_CVE <- cve_affected_product[,c(1:5)]
Product_CVE <- unique(Product_CVE[,list(Year,`Vendor name`,`Product name`, CVE, Major)])
Product_CVE <- Product_CVE[,c(1:4)][,count:=1]
Product_CVE <- setDT(aggregate(.~ Year+`Vendor name`+`Product name`+CVE ,data=Product_CVE,FUN=sum))
setorder(Product_CVE, Year, `Vendor name`,`Product name`, CVE)

products <- as.character(unique(Product_CVE$`Product name`))

for(i in 1:length(products)){
  tempdf <- Product_CVE[Product_CVE$`Product name`==products[i],]
  ifelse(tempdf$`Vendor name`==tempdf$`Product name`,
         dfname <- paste("df_",products[i],sep=""),
         dfname <- paste("df",products[i],sep=""))

    ifelse(tempdf$`Vendor name`==tempdf$`Product name`,
         dsname <- paste("ds_",products[i],sep=""),
         dsname <- paste("ds",products[i],sep=""))

  X <- tibble(
    name = gsub("-", "", c(tempdf$CVE)),
    y = c(tempdf$count),
    drilldown = tolower(paste(name,'id'))
  )

  Y <- second_el_to_numeric(list_parse2(assign(dfname,X)))

    assign(dsname,Y)

}

# CVE View HC ###########
hc <- hc %>%
  hc_drilldown(
    allowPointDrilldown = TRUE,
    series = list(
      list(
        id = "sendmail id",
        data = dssendmail,
        keys = list('name','y','drilldown')
      ),
      list(
        id = "ftp id",
        data = ds_ftp,
        keys = list('name','y','drilldown')
      ),
      list(
        id = "ftpcd id",
        data = ds_ftpcd,
        keys = list('name','y','drilldown')
      ),
      list(
        id = "bsd id",
        data = ds_bsd,
        keys = list('name','y','drilldown')
      ),
      list(
        id = "sunos id",
        data = dssunos,
        keys = list('name','y','drilldown')
      ),
      list(
        id = "vms id",
        data = dsvms,
        keys = list('name','y','drilldown')
      ),
      list(
        id = "freebsd id",
        data = ds_freebsd,
        keys = list('name','y','drilldown')
      ),
      list(
        id = "apollo_domain_os id",
        data = dsapollo_domain_os,
        keys = list('name','y','drilldown')
      ),
      list(
        id = "nex id",
        data = dsnex,
        keys = list('name','y','drilldown')
      ),
      list(
        id = "next id",
        data = ds_next,
        keys = list('name','y','drilldown')
      )
    )
  )
Output Second Level Clicking on 1988:

ISSUES: I should be able to click on vendor eric_allman and get a drill down, however I am not. I want to be able to drill down all the way to Revision if it exists. This is just prototypying new functionality for my app to get it working. However, highcharter does not make this easy or efficient. My dataset has almost 4 million observations. That will be the next struggle how to handle that.
I am even considering using D3 by creating a JSON file in python if I cannot do it using R. However, creating the JSON file in python is not trivial but doable. I am currently working on python code as a back up.
Thank you for the help and any suggestions
