I have tried several to draw a graph representing with consecutive states in a straight line, S0 -> S1 -> S2. Then actions in another straight line below. There are edges between S0 -> A0 -> S1 -> A1 -> S2. Which forms triangles lined up next to each other.

I have tried to use a cluster, and rank=same for the nodes I want to align. I also tried to use [constraint=false] and other answers on Stack Overflow.
\begin{dot2tex}[fdp]
digraph G {
    newrank=true;
    node[group="states"]
    S0 [texlbl="$S_{t-2}$", shape=none];
    S1 [texlbl="$S_{t-1}$", shape=none];
    S2 [texlbl="$S_t$", shape=none];
    S3 [texlbl="$S_{t+1}$", shape=none];
    node[group=""]
    A0 [texlbl="$A_{t-2}$", shape=none];
    A1 [texlbl="$A_{t-1}$", shape=none];
    A2 [texlbl="$A_t$", shape=none];
    { rank=same; S0; S1; S2; S3;
    S0 -> S1-> S2 -> S3;
    S0 -> A0;
    S1 -> A1;
    S2 -> A2; }
    A0 -> S1;
    A1 -> S2;
    A2 -> S3;
}
\end{dot2tex}
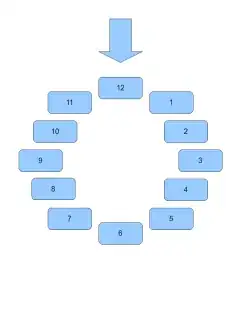
However the output from the graph is a mixture of states and actions on a curve.


