after quite some time searching through SO, I did not find an example that solved my question:
How to label geom_bar(position = 'fill') using geom_text()?
mydf = data.frame(
  'sample' = sample(x = LETTERS[1:3], size = 111,replace = T),
  'category' = sample(x = 1:11, size = 111,replace = T)
)


mydf %>%
  group_by(sample) %>%
  ggplot( aes(fill=sample, x=category)) +
  geom_bar( position="fill" )
 # Does not work: +  geom_text(position='fill', aes(label = ..y..))
Intended outcome: label the % in the middle of the bars, as in the example (except that it shows the count, unlike needed in my case):
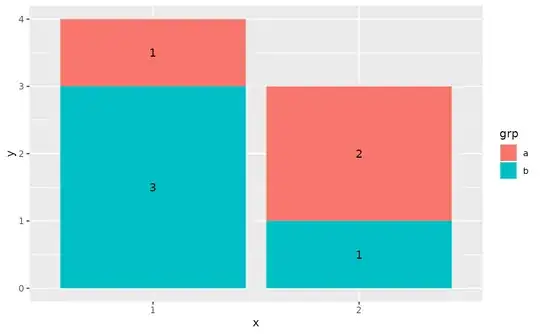 from https://ggplot2.tidyverse.org/reference/geom_text.html
I guess the real question is what is "y" and "label" if I use geom_bar(position = 'fill'),
I am confused by ggplot blending calculations (proportions per category) with visualization.
Thanks!