-1

I'm trying to draw ZigZag line on another line. There are top and bottom points in my base line (price). I'm trying to connect the top and bottom points with a line. This is an example:

enter image description here

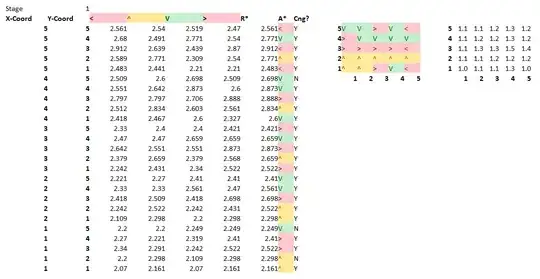
This is my dataset:

enter image description here

And this is how far I could go:

enter image description here

Any help is appreciated.

Edit 1:

This is my not working code:

trend_index = target_out.columns.get_loc("trend_shifted")
close_index = target_out.columns.get_loc("price_close")

for i in range(1, len(target_out)):
       if target_out.iloc[i, trend_index] == target_out.iloc[i-1, trend_index] and target_out.iloc[i-1, trend_index] is not None:
            target_out.iloc[i, trend_index] = np.nan
            target_out.iloc[i-1, trend_index] = target_out.iloc[i-1, close_index]

# multiple line plot
plt.plot( 'ind', 'price_close', data=target_out, marker='o', markerfacecolor='blue', markersize=12, color='skyblue', linewidth=4)
plt.plot( 'ind', 'trend_shifted', data=target_out, marker='', color='olive', linewidth=2)
plt.legend()

trend_shifted column has ones and zeros. The first element of consecutive ones and zeros are actually top and bottom points for the zigzag. The rest of the points is not important. After determining the top and bottom points, I need to draw a line but since the price and trend have relatively different values, the chart is unbalanced (I mean, price is like 0.00001 but trend is 0 and 1)

Edit 2:

@rgk's code works. This is the output:
enter image description here

iso_9001_
  • 2,655
  • 6
  • 31
  • 47
  • 1
    Can you share a code sample? – rgk Mar 06 '19 at 15:14
  • @rgk Of course, what part do you need? My try? – iso_9001_ Mar 06 '19 at 17:58
  • The main thing is it looks like you're trying to plot both series on the same axis when you ought to be plotting the prices twice - see my answer below – rgk Mar 06 '19 at 21:33
  • A little bit off-topic but could you please share how did you make the trend shifted column? – Thanh Nguyen Jan 01 '20 at 13:31
  • How do you get the zigzag values? I'm working on something like this, please let me know if you have any idea! https://stackoverflow.com/questions/63164124/zigzag-indicator-metastock-formula-to-python – Martin Facts Jul 30 '20 at 00:10

1 Answers1

1

Although this may not work perfectly for you since there isn't a code example given, I think using a mask array and plotting this separately against the index will accomplish what you're looking for:

df = pd.DataFrame({'price_close': np.random.uniform(low=1.186e-05, high=1.255e-05, size=9),
                   'trend_shifted': [bool(random.getrandbits(1)) for x in range(1, 10)]})

df['trend_plot'] = [np.nan] + [df.price_close[i] if df.trend_shifted[i] != df.trend_shifted[i-1] else np.nan for i in range(1, len(df))]
mask = np.isfinite(df.trend_plot)

plt.plot(df.index, df.price_close, linestyle='-', marker='o')
plt.plot(df.index[mask], df.trend_plot[mask], linestyle='-', marker='o')
plt.show()

example plot & data

rgk
  • 985
  • 8
  • 16
  • Thanks for the code. Your masking code does exactly what I try to do but the result is not like the original zigzag. Is it because it is randomly generated? I'll try your code with my data – iso_9001_ Mar 07 '19 at 07:21
  • Yes - the trend_shifted data in my example was randomly generated. Didn't think me figuring out that logic was going to help you solve the problem. Glad to hear you're in good shape! – rgk Mar 07 '19 at 13:50