I have breeding bird assemblages data from quarry and calcareous grassland sites and want to display them in a nmds ordination plot, together with environmental parameters as vectors. How can I unclutter the species tags? I'm using the vegan package for ordination.
I have already reduced the number of species displayed using the ordiselect function from goeveg package. Tags are still overlapping but I don't want to further reduce species.
With the orditkplot function I can't seem to get a result that looks as good as I want it to in terms of aesthetics. I also failed to display only a subset of species when using that function.
ord.nmds <- metaMDS(species, trace=FALSE)
sel <- ordiselect(species, ord.nmds, ablim = 0.5, method = "axes", freq = TRUE)
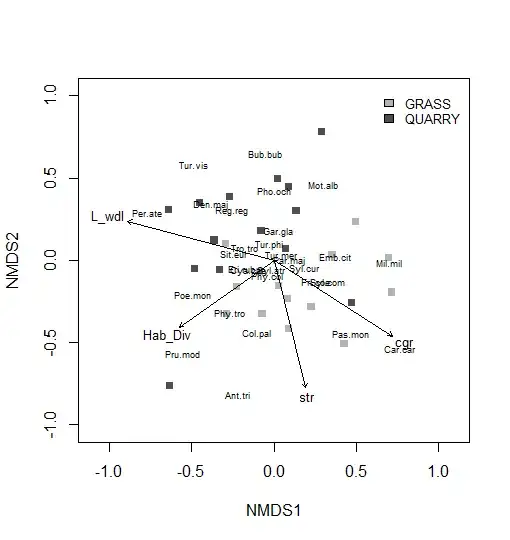
ef <- envfit(ord.nmds ~ cgr + L_wdl + str + Hab_Div, env_var, permu=999)
grp <- factor(rep(c("GRASS", "QUARRY"), each = 14))
cols <- c("gray70","gray30")
plot(ord.nmds, type="n", xlim = c(-1.1, 1.1), ylim = c(-0.9,0.9))
points(ord.nmds, display = "sites", pch = 15, col = rep(cols, each = 14), cex=1)
text(ord.nmds, display = "species", col="black", cex=0.55, select = sel)
plot(ef, p.max = 0.05, col ="black", cex = 0.8)
legend(x = 0.6, y = 1.05, legend = tools::toTitleCase(levels(grp)), fill = cols, bty = "n", cex = 0.8)
So far, my plot looks like this: