I have build a scatter plot in d3 v4 using following link: scatter plot
I have also used tipsy plugin for tooltip.
Now i wanted to add guidelines in this chart that is show guideline when user hovers over a circle and hide guidelines when out of focus. For this i stumbled upon a code which i tried to use but it is not showing anything.
Following is the code which i used:
var circles = svg.selectAll("circle").data(dataset).enter().append("circle");
              circles.attr("cx",function(d){
                    return xScale(d[indicator1]);//i*(width/dataset.length);
                    })
              .attr("cy",function(d){
                return yScale(d[indicator2]);
              })//for bottom to top
              .attr("r", 10);
              circles.attr("fill",function(d){
                return "#469DDA";
              });
              circles.attr("stroke",function(d){
                return "white";
              });
              circles.attr("class", "circles");
              svg.style('pointer-events', 'all')
               // what to do when we mouse over a bubble
              var mouseOn = function() {
                var circle = d3.select(this);
                // transition to increase size/opacity of bubble
                circle.transition()
                .duration(800).style("opacity", 1)
                .attr("r", 16).ease("elastic");
                // append lines to bubbles that will be used to show the precise data points.
                // translate their location based on margins

                svg.append("g")
                  .attr("class", "guide")
                .append("line")
                  .attr("x1", circle.attr("cx"))
                  .attr("x2", circle.attr("cx"))
                  .attr("y1", +circle.attr("cy") + 26)
                  .attr("y2", h - margin.t - margin.b)
                  .attr("transform", "translate(40,20)")
                  .style("stroke", "#ccc")
                  .transition().delay(200).duration(400).styleTween("opacity",
                        function() { return d3.interpolate(0, .5); })
                svg.append("g")
                  .attr("class", "guide")
                .append("line")
                  .attr("x1", +circle.attr("cx") - 16)
                  .attr("x2", 0)
                  .attr("y1", circle.attr("cy"))
                  .attr("y2", circle.attr("cy"))
                  .attr("transform", "translate(40,30)")
                  .style("stroke", "#ccc")
                  .transition().delay(200).duration(400).styleTween("opacity",
                        function() { return d3.interpolate(0, .5); });
                // function to move mouseover item to front of SVG stage, in case
                // another bubble overlaps it
               /* d3.selection.prototype.moveToFront = function() {
                  return this.each(function() {
                  this.parentNode.appendChild(this);
                  });
                };
               // skip this functionality for IE9, which doesn't like it
                if (!$.browser.msie) {
                  circle.moveToFront();
                }*/
              };
               // what happens when we leave a bubble?
              var mouseOff = function() {
                var circle = d3.select(this);

                // go back to original size and opacity
                circle.transition()
                .duration(800).style("opacity", 1)
                .attr("r", 10).ease("elastic");

                // fade out guide lines, then remove them
                d3.selectAll(".guide").transition().duration(100).styleTween("opacity",
                        function() { return d3.interpolate(.5, 0); })
                  .remove()
              };
               // run the mouseon/out functions
              circles.on("mouseover", mouseOn);
              circles.on("mouseout", mouseOff);
              $('.circles').tipsy({
                gravity: 'w',
                html: true,
                title: function() {
                  var d = this.__data__;
                  return "State: "+d.States+"<br>"+indicator1+" "+d[indicator1]+"<br>"+indicator2+" "+d[indicator2];
                }
              });
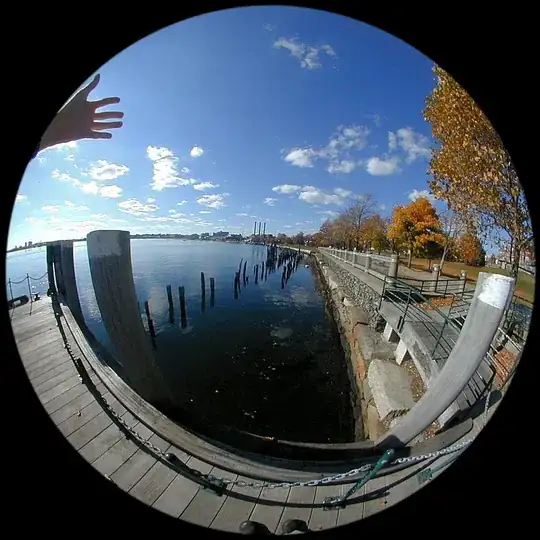
I am getting following result now:
When i checked the browser console i am getting following error:

