2

I am trying to plot two 3D wireframe plot and a colorbar in one one row within a single figure. In order to apply color ramp on the wireframe I followed this Stackoverflow Answer. I had to generate independent colorbar because of this. Since I am using tight_layout the colorbar is consuming the entire height and appearing with large width.

So far I could not find any solution to control the size of the colorbar. I tried changing the width_ratio of the grid but the width remains unchanged. It seems the height can not be adjusted in the tight layout.

My Code for plotting is given below. I will be grateful for any help in this regard.

def plot_signature(hh, hv, vh, vv,  wireframe=False):

    x_c, y_c, z_c = synthesize(hh=hh, hv=hv, vh=vh, vv=vv, channel=False)
    x_x, y_x, z_x = synthesize(hh=hh, hv=hv, vh=vh, vv=vv, channel=True)

    xticks = np.linspace(0, 180, 13)
    yticks = np.linspace(-45, 45, 7)
    zticks = np.linspace(0, 1, 11)

    xt_labels = np.core.defchararray.add(xticks.astype(int).astype(str), u"\u00b0")
    yt_labels = np.core.defchararray.add(yticks.astype(int).astype(str), u"\u00b0")

    plt.ion()

    fig = plt.figure(tight_layout=True)
    grid = fig.add_gridspec(nrows=1, ncols=3, width_ratios=[1, 10, 10])
    ax_cbar = fig.add_subplot(grid[0, 0])
    ax_cpol = fig.add_subplot(grid[0, 1], projection='3d')
    ax_xpol = fig.add_subplot(grid[0, 2], projection='3d')

    ax_cpol.set_xlim([0, 180])
    ax_cpol.set_ylim([-45, 45])
    ax_cpol.set_zlim([0, 1])

    ax_xpol.set_xlim([0, 180])
    ax_xpol.set_ylim([-45, 45])
    ax_xpol.set_zlim([0, 1])

    cfont = {'fontname':'CMU Serif'}
    color_map = cm.rainbow

    if wireframe:
        norm_c = plt.Normalize(z_c.min(), z_c.max())
        norm_x = plt.Normalize(z_x.min(), z_x.max())
        colors_c = color_map(norm_c(z_c))
        colors_x = color_map(norm_c(z_x))
        rcount_c, ccount_c, _ = colors_c.shape
        rcount_x, ccount_x, _ = colors_x.shape
        pfig_c = ax_cpol.plot_surface(x_c, y_c, z_c, rcount=rcount_c, ccount=ccount_c, facecolors=colors_c, shade=False)
        pfig_x = ax_xpol.plot_surface(x_x, y_x, z_x, rcount=rcount_x, ccount=ccount_x, facecolors=colors_x, shade=False)
        pfig_c.set_facecolor((0, 0, 0, 0))
        pfig_x.set_facecolor((0, 0, 0, 0))
    else:
        ax_cpol.plot_surface(x_c, y_c, z_c, cmap=color_map, linewidth=0, antialiased=True)
        ax_xpol.plot_surface(x_x, y_x, z_x, cmap=color_map, linewidth=0, antialiased=True)

    ax_cpol.set_xticks(xticks)
    ax_xpol.set_xticks(xticks)
    ax_cpol.set_xticklabels(xt_labels)
    ax_xpol.set_xticklabels(xt_labels)
    ax_cpol.set_yticks(yticks)
    ax_xpol.set_yticks(yticks)
    ax_cpol.set_yticklabels(yt_labels)
    ax_xpol.set_yticklabels(yt_labels)
    ax_cpol.set_xlabel('Orientation Angle ($\psi$)', labelpad=16, fontsize=16, **cfont)
    ax_xpol.set_xlabel('Orientation Angle ($\psi$)', labelpad=16, fontsize=16, **cfont)
    ax_cpol.set_ylabel('Ellipticity Angle ($\chi$)', labelpad=16, fontsize=16, **cfont)
    ax_xpol.set_ylabel('Ellipticity Angle ($\chi$)', labelpad=16, fontsize=16, **cfont)
    ax_cpol.set_zlabel("Relative Intensity", labelpad=16, fontsize=16, **cfont)
    ax_xpol.set_zlabel("Relative Intensity", labelpad=16, fontsize=16, **cfont)
    ax_cpol.set_zticks(zticks)
    ax_xpol.set_zticks(zticks)
    ax_cpol.set_title("Co-pol Signature", fontsize=20, pad=20, **cfont)
    ax_xpol.set_title("Cross-pol Signature", fontsize=20, pad=20, **cfont)

    cb_norm = mpl.colors.Normalize(vmin=0,vmax=1)
    cb_ticks = np.linspace(0.0, 1.0, 11)

    cb = mpl.colorbar.ColorbarBase(
        ax_cbar,cmap=color_map,
        norm=cb_norm,ticks=cb_ticks,
        label='Color Map',
        orientation='vertical'
    )

    cb_label = cb.ax.yaxis.label
    cb.ax.yaxis.labelpad = 10
    custom_font = mpl.font_manager.FontProperties(family='CMU Serif', size=12)
    cb_label.set_font_properties(custom_font)
    plt.show()

Currently the plot looks like the following:

Current Plot

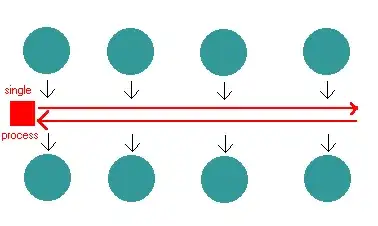
However, I want it to be something like below:

Expected Plot

tachyon
  • 471
  • 3
  • 14
  • Try to use `shrink`, `aspect` and `fraction` arguments of colorbar https://matplotlib.org/api/_as_gen/matplotlib.pyplot.colorbar.html – Serenity Jan 31 '19 at 07:26
  • I am using [matplotlib.colorbar.ColorbarBase](https://matplotlib.org/api/colorbar_api.html#matplotlib.colorbar.ColorbarBase) object as it is an independent colorbar. Unfortunately ColorbarBase object does not support `shrink`, `aspect` or `fraction` (See the answer: [Stackoverflow Question](https://stackoverflow.com/questions/40227283/setting-the-size-of-a-matplotlib-colorbarbase-object)); it inherits the properties of parent axes. – tachyon Jan 31 '19 at 08:26
  • In this case play with `ax` argument to setup your own colorbar: https://matplotlib.org/gallery/axes_grid1/demo_colorbar_with_inset_locator.html and https://stackoverflow.com/a/13311914/2666859 – Serenity Feb 01 '19 at 00:27

2 Answers2

1

Currently you use a 1 x 3 grid.

enter image description here

Consider using a 3 x 3 grid where the 3D plots cover all three rows, while the colorbar is only in the second row.

enter image description here

Note that the colorbar should of course use the same normalization as the surface plots. And the surface plots should use identical normalizations. Short: There should be one single normalization, else the plot would convey the wrong message.

Finally, there is no need to use ColorbarBase here; better use

sm = plt.cm.ScalarMappable(cmap=cmap, norm=norm)
sm.set_array([])  # still needed for matplotlib <= 3.0
fig.colorbar(sm, cax=cax) 

This might allow for different options to shrink the colorbar as well.

Ideally an answer would turn all this into code, but there is not runnable code in the question that would allow to easily do that.

ImportanceOfBeingErnest
  • 321,279
  • 53
  • 665
  • 712
  • Thank you. I was about to write the exactly this solution which I figured out on my own yesterday. First I tried the second approach, i. e. using `colorbar` instead of `ColorBarBase` and I did it a bit differently. However `shrink`, `fraction` etc did not work. Next I divided the figure space just like you showed, using `GridSpec` and `SubplotSpec`. It is perfect now. I will post my code for reference. – tachyon Feb 01 '19 at 07:18
0

ImportanceOfBeingErnes has already posted the right working solution. I am going to show the implementation of his answer. Please note, I have implemented the wireframe plot with colormap a bit differently(Source) this time.

def plot_signature(hh, hv, vh, vv, wireframe=False):
    x_c, y_c, z_c = synthesize(
        hh=hh,
        hv=hv,
        vh=vh,
        vv=vv,
        channel=False
    )

    x_x, y_x, z_x = synthesize(
        hh=hh,
        hv=hv,
        vh=vh,
        vv=vv,
        channel=True
    )

    xticks = np.linspace(0, 180, 13)
    yticks = np.linspace(-45, 45, 7)
    zticks = np.linspace(0, 1, 11)

    xt_labels = np.core.defchararray.add(
        xticks.astype(int).astype(str),
        u"\u00b0"
    )

    yt_labels = np.core.defchararray.add(
        yticks.astype(int).astype(str),
        u"\u00b0"
    )

    plt.ion()
    fig = plt.figure(num='Polarimetric Signatures', tight_layout=True)

    gs_root = mpl.gridspec.GridSpec(
        nrows=1,
        ncols=3,
        width_ratios=[1, 10, 10]
    )

    cb_gs = mpl.gridspec.GridSpecFromSubplotSpec(
        nrows=3,
        ncols=3,
        height_ratios=[2, 5, 2],
        width_ratios=[1.1, 0.8, 1.1],
        subplot_spec=gs_root[0]
    )

    ax_cbar = fig.add_subplot(cb_gs[1, 1])
    ax_cpol = fig.add_subplot(gs_root[0, 1], projection='3d')
    ax_xpol = fig.add_subplot(gs_root[0, 2], projection='3d')

    ax_cpol.set_xlim([0, 180])
    ax_cpol.set_ylim([-45, 45])
    ax_cpol.set_zlim([0, 1])

    ax_xpol.set_xlim([0, 180])
    ax_xpol.set_ylim([-45, 45])
    ax_xpol.set_zlim([0, 1])

    cfont = {'fontname': 'CMU Serif'}
    color_map = cm.rainbow

    if wireframe:

        wire_c = ax_cpol.plot_wireframe(
            x_c,
            y_c,
            z_c,
            rstride=1,
            cstride=2
        )
        nx_c, ny_c, _ = np.shape(wire_c._segments3d)
        wire_c_x = np.array(wire_c._segments3d)[:, :, 0].ravel()
        wire_c_y = np.array(wire_c._segments3d)[:, :, 1].ravel()
        wire_c_z = np.array(wire_c._segments3d)[:, :, 2].ravel()
        wire_c.remove()
        wire_c_x1 = np.vstack([wire_c_x, np.roll(wire_c_x, 1)])
        wire_c_y1 = np.vstack([wire_c_y, np.roll(wire_c_y, 1)])
        wire_c_z1 = np.vstack([wire_c_z, np.roll(wire_c_z, 1)])
        to_delete = np.arange(0, (nx_c * ny_c), ny_c)
        wire_c_x1 = np.delete(wire_c_x1, to_delete, axis=1)
        wire_c_y1 = np.delete(wire_c_y1, to_delete, axis=1)
        wire_c_z1 = np.delete(wire_c_z1, to_delete, axis=1)
        scalars_c = np.delete(wire_c_z, to_delete)
        segs_c = [
            list(zip(x_c, y_c, z_c))
            for x_c, y_c, z_c in zip(wire_c_x1.T, wire_c_y1.T, wire_c_z1.T)
        ]
        my_wire_c = art3d.Line3DCollection(segs_c, cmap=color_map)
        my_wire_c.set_array(scalars_c)
        ax_cpol.add_collection(my_wire_c)

        wire_x = ax_xpol.plot_wireframe(
            x_x,
            y_x,
            z_x,
            rstride=1,
            cstride=2
        )
        nx_x, ny_x, _ = np.shape(wire_x._segments3d)
        wire_x_x = np.array(wire_x._segments3d)[:, :, 0].ravel()
        wire_x_y = np.array(wire_x._segments3d)[:, :, 1].ravel()
        wire_x_z = np.array(wire_x._segments3d)[:, :, 2].ravel()
        wire_x.remove()
        wire_x_x1 = np.vstack([wire_x_x, np.roll(wire_x_x, 1)])
        wire_x_y1 = np.vstack([wire_x_y, np.roll(wire_x_y, 1)])
        wire_x_z1 = np.vstack([wire_x_z, np.roll(wire_x_z, 1)])
        to_delete = np.arange(0, (nx_x * ny_x), ny_x)
        wire_x_x1 = np.delete(wire_x_x1, to_delete, axis=1)
        wire_x_y1 = np.delete(wire_x_y1, to_delete, axis=1)
        wire_x_z1 = np.delete(wire_x_z1, to_delete, axis=1)
        scalars_x = np.delete(wire_x_z, to_delete)
        segs_x = [
            list(zip(x_x, y_x, z_x))
            for x_x, y_x, z_x in zip(wire_x_x1.T, wire_x_y1.T, wire_x_z1.T)
        ]
        my_wire_x = art3d.Line3DCollection(segs_x, cmap=color_map)
        my_wire_x.set_array(scalars_x)
        ax_xpol.add_collection(my_wire_x)

        cb_norm = mpl.colors.Normalize(vmin=0, vmax=1)
        cb_ticks = np.linspace(0.0, 1.0, 11)
        cb = plt.colorbar(
            my_wire_c,
            ax_cbar, cmap=color_map,
            norm=cb_norm, ticks=cb_ticks,
            orientation='vertical',
            label="Color Map",
            ticklocation='left'
        )
        cb_label = cb.ax.yaxis.label
        cb.ax.yaxis.labelpad = 10
        custom_font = mpl.font_manager.FontProperties(
            family='CMU Serif',
            size=12
        )
        cb_label.set_font_properties(custom_font)

    else:
        ax_cpol.plot_surface(
            x_c,
            y_c,
            z_c,
            cmap=color_map,
            linewidth=0,
            antialiased=True
        )

        ax_xpol.plot_surface(
            x_x,
            y_x,
            z_x,
            cmap=color_map,
            linewidth=0,
            antialiased=True
        )

    ax_cpol.set_xticks(xticks)
    ax_xpol.set_xticks(xticks)
    ax_cpol.set_xticklabels(xt_labels)
    ax_xpol.set_xticklabels(xt_labels)
    ax_cpol.set_yticks(yticks)
    ax_xpol.set_yticks(yticks)
    ax_cpol.set_yticklabels(yt_labels)
    ax_xpol.set_yticklabels(yt_labels)
    ax_cpol.set_xlabel(
        'Orientation Angle ($\psi$)',
        labelpad=16,
        fontsize=16,
        **cfont
    )
    ax_xpol.set_xlabel(
        'Orientation Angle ($\psi$)',
        labelpad=16,
        fontsize=16,
        **cfont)
    ax_cpol.set_ylabel(
        'Ellipticity Angle ($\chi$)',
        labelpad=16,
        fontsize=16,
        **cfont
    )
    ax_xpol.set_ylabel(
        'Ellipticity Angle ($\chi$)',
        labelpad=16,
        fontsize=16,
        **cfont
    )
    ax_cpol.set_zlabel(
        "Relative Intensity",
        labelpad=16,
        fontsize=16,
        **cfont
    )
    ax_xpol.set_zlabel(
        "Relative Intensity",
        labelpad=16,
        fontsize=16,
        **cfont
    )
    ax_cpol.set_zticks(zticks)
    ax_xpol.set_zticks(zticks)
    ax_cpol.set_title(
        "Co-pol Signature",
        fontsize=20,
        pad=20,
        **cfont
    )
    ax_xpol.set_title(
        "Cross-pol Signature",
        fontsize=20,
        pad=20,
        **cfont
    )

    plt.show()

    return 0

Current Output is shown below:

Latest Plot

tachyon
  • 471
  • 3
  • 14