4

When saving graphics in Mathematica, is it possible to save figures with opacity in EPS format? For example,

Plot[Evaluate[Table[BesselJ[n, x], {n, 4}]], {x, 0, 10}, 
 Filling -> Axis]

gives the following figure which saves neatly in any format other than EPS.

Transparency in Mma

If I try saving to EPS (in Mathematica 7), the result looks like

EPS from Mma7

In Mathematica 8 it looks like

EPS from Mma8

Does anyone know how to get opacity in EPS plots (or if that is even possible)? The 'use rasterization for transparency' option doesn't look as impressive as a true EPS on zooming.

Simon
  • 14,631
  • 4
  • 41
  • 101
  • [Wikipedia claims](http://en.wikipedia.org/wiki/Transparency_%28graphic%29#Transparency_in_PostScript) that EPS does not support true transparency. But PDF does... I assume you want the graphics for a LaTeX document? Why not just use pdflatex? – Simon Mar 24 '11 at 07:15
  • As a side note: the colors in Mma8's EPS export are a lot better! – Simon Mar 24 '11 at 07:17
  • @Simon: I work mostly with MATLAB and the bounding box in EPS figures from MATLAB are pretty tight (like in Mma). The PDF files from MATLAB, on the other hand, have additional whitespace. So to avoid having to deal with converting, cropping etc., I simply use latex, and not pdflatex. I know that I can use the `epstopdf` package that does the conversion on the fly in pdflatex. However, a couple of journal specific style sheets break this and are not compatible with that package. –  Mar 24 '11 at 07:24
  • @Simon: I did know that EPS doesn't support true transparency. However, the opacity can be adequately represented by equivalent lighter colors, and was wondering if there was such an option to alter the color after opacity to its equivalent solid lighter color in Mma. –  Mar 24 '11 at 07:25
  • With Mma8 the plot is exported correctly with simulated transparency to EPS. What version of Mma are you using? – Dr. belisarius Mar 24 '11 at 09:04
  • @belisarius: Mma 7. Damn, I need to find a copy of 8 somewhere... –  Mar 24 '11 at 14:20
  • @belisarius: Are you sure? The colors are better, ie the filling is lighter than the curves, but they are not merged in a simulated transparency... The filling is drawn first, in order of the functions, then the lines in order, then the axes and tick marks. (At least that's how it is on my system.) – Simon Mar 25 '11 at 00:08
  • @belisarius: I tested viewing the eps file in lots of programs (since transparency depends on the renderer). Evince, GIMP, inkscape and even importing back into Mathematica, there is no transparency. – Simon Mar 25 '11 at 00:19
  • To clarify the discussion a little, I added the EPS image generated by Mma8 (and converted to png using imagemagick). I hope that's ok. – Simon Mar 25 '11 at 00:26
  • @Simon: Thanks. You're right; that still looks like mma7, but with lighter colors. –  Mar 25 '11 at 00:34
  • @d'o-o'b: The [epstopdf package](http://www.ctan.org/pkg/epstopdf-pkg) doesn't delete the pdf file (and only reconverts if the eps changes). So you can just run it on your machine, then comment out the package before sending it to the journal with both eps and pdf. Or simply manually run [epstopdf](http://www.ctan.org/pkg/epstopdf). Another alternative is there's a [matlab package that fixes the pdf export](http://www.mathworks.com/matlabcentral/fileexchange/10889-savefig). Also there's [pdfcrop](http://ctan.org/pkg/pdfcrop). – Simon Mar 25 '11 at 00:40
  • @Simon: Thanks for the matlab file and pdfcrop. Those should pretty much do the trick for me. However, I'm slowly making the shift to Mma for my graphics, just because it is prettier and more customizable than Matlab. –  Mar 25 '11 at 00:54
  • As for fixing the Mma7 output, EPS is plain text. The rgb colors are bound to `r`. So look for lines that are like `rnum gnum bnum r` and increase all `*num` associated with `F`=filled paths to get the same, but lighter color. It would be possible to write a script to do this. – Simon Mar 25 '11 at 00:55

3 Answers3

3

I usually Rasterize my graphics in this situation. Try

Rasterize[Plot[Evaluate[Table[BesselJ[n, x], {n, 4}]],
  {x, 0, 10}, Filling -> Axis], RasterSize -> 600, ImageSize -> 400]

Of course, the result will not be scalable and can take up more memory. You can partially solve the scalability problem by setting the RasterSize larger than the ImageSize, as I have done here.

Mark McClure
  • 4,862
  • 21
  • 34
  • @Mark: Although I didn't want to rasterize, I guess this seems like the only way to go. Or, I can suck it up and use PDFs or get Mma 8. –  Mar 24 '11 at 14:26
  • This is the standard advice for 3D graphics and produces very nice images with actually reduced file size. PDF also has disadvantages. With PDFTeX, for example, you can't use psfrag, which allows you to easily embed the ambient fonts of the document into your image. – Mark McClure Mar 24 '11 at 15:13
3

OK, so EPS can not support true transparency/opacity - but that doesn't mean that Mathematica 7 is excused for doing such a bad job. As evidenced my Mathematica 8, it is possible to make it look better.

The problem with Mathematica 7's output is that it uses the same color for the fill as for the curves, when you really want a lighter color. EPS is a plain text format, so it's quite easy to write a quick hack. Here's a quick tute on PS graphics.

In PS graphics, you define a path then you say whether you want it stroked (lines) or filled (areas) - or other things we don't need to worry about. Colors are set and stay there until they are reset. So I simply import the EPS produced by Mma7 and find all filled paths. For each filled path you find the previous color and reset the color just above the fill command to be something lighter.

So here's an example (I haven't bothered packaging it up into a single script/module). All output is from Mathematica 7.0.1

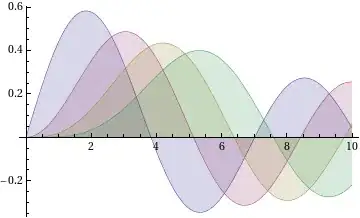
p = Plot[Evaluate[Table[BesselJ[n, x], {n, 4}]], {x, 0, 10}, Filling -> Axis]

original image

Export to an EPS file using Export["BesselJs7.eps", p]. This produces a horrible graphic like
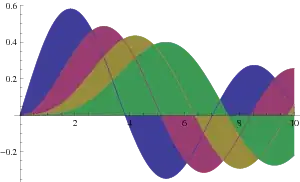
 original EPS

OK, now the "fix"

pList = Import["BesselJs7.eps", "List"];  (* Import image as a list of strings *)
FList = Flatten@Position[pList, "F"];     (* find all fill commands            *)

Note that the EPS file has the line /F { fill} bind def that defines the shortcut F. Also, you can check that pList[[FList - 1]] yields a list of "closepath"s.

FColorList = {}; (* get list of colors associated with fills *)
Catch[Do[
  i = 0; rgb = True; newpath = True;
  While[rgb || newpath,
   (*Print[{f,i,f-i,rgb,newpath,pList[[f-i]]}];*)
   If[rgb && StringMatchQ[pList[[f - i]], __ ~~ "r"], rgb = False; 
    AppendTo[FColorList, pList[[f - i]]]];
   If[newpath && StringMatchQ[pList[[f - i]], "newpath" ~~ __], 
    newpath = False; np[f] = f - i];
   If[f - i == 1, Throw[{f, rgb, newpath}]];
   i++],
  {f, FList}]]

Now a hack to create the new colors - all I do is add .5 to each rgb value. This can definitely be made better:

FColorListNew = Table[Most@ToExpression@StringSplit[f] + .5, 
                {f, FColorList}] /. _?(# > 1 &) -> 1.;
FColorListNew = Table[StringJoin[{Riffle[ToString /@ f, " "], " r"}],
                {f, FColorListNew}];

Finally, insert the new colors and write it back out:

Do[pList = Insert[pList, FColorListNew[[i]], np[FList[[i]]] + i], 
   {i, Length[FList]}]
Export["BesselJsFixed.eps", pList, "List"]

fixed EPS

Some things, like finding the newpath locations, are unnecessary and the whole thing can probably be tidied up. But I've spent enough time on it for now!

Simon
  • 14,631
  • 4
  • 41
  • 101
  • whoa simon! you've got a lot of spare time on your hands to fiddle around mma. thanks for the insight and "fix" for mma7. seeing your approach has given me an idea to "solve" the transparency problem. given that you can import the paths & colors, it should be possible to find intersecting regions and reshade the overlaps with `(rgb_1+...+rgb_n)/n`, where `n` is the number of overlapping regions. I don't know mma enough to take on that task at the moment, but for sure will be interesting to try some day. –  Mar 25 '11 at 03:11
  • 3
    @d'o-o'b: It took a little over an hour this morning.... would have been quicker if I read about PS graphics *before* trying to write the "fix". Also, I don't have free time - I'm meant to be spending every spare second writing up my thesis! I thought about the blending... should be possible, but would require more work. – Simon Mar 25 '11 at 03:46
  • 1
    I didn't mean it in a bad way. I'm a year or so away from finishing my own thesis, so I fully know the feeling where you want to try to do everything else other than stuff that needs to be done. –  Mar 25 '11 at 04:44
1

Building on Mark's answer, to export a PNG with transparency, use:

Export[
  "testfile.png",
  Plot[Evaluate[Table[BesselJ[n, x], {n, 4}]], {x, 0, 10}, Filling -> Axis],
  ImageSize -> 600,
  Background -> None
]
Mr.Wizard
  • 24,179
  • 5
  • 44
  • 125