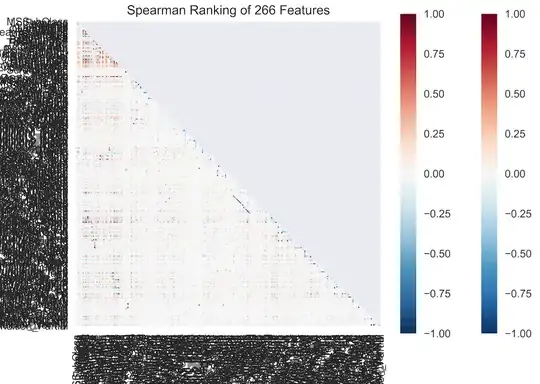
I have this error in a graphing package I am using, yellowbrick, where, because of the extreme size of the resulting image, the labels around the graph I am trying to save do not get rendered properly.
The command I am using is Rank2D, which is simple and graphs correctly for smaller datasets, but my dataset happens to contain lots of variables, and I would like to at least try to look at it.
Because yellowbrick is based on matplotlib, I tried many different options to get a large enough image so that the text labels end up fitting next to each other. Setting dpi=>300 makes the cells in the middle very clear after zooming in, with the same error, so I am thinking this is specifically a text sizing/resolution issue. Changing the image format to svg, or anything else, also fails.
Does anybody have any recommendations on what I can do?
