# Create the dataset
library(tidyverse)
set.seed(0)
species = c(rep("sorgho", 3), rep("poacee", 3), rep("banana", 3), rep("tri", 3))
condition = rep(c("normal", "stress", "nitrogen"), 4)
value = abs(rnorm(12, 0, 15))
data = data.frame(species, condition, value)

#>    species condition       value
#> 1   sorgho    normal 18.94431427
#> 2   sorgho    stress  4.89350041
#> 3   sorgho  nitrogen 19.94698894
#> 4   poacee    normal 19.08643982
#> 5   poacee    stress  6.21962152
#> 6   poacee  nitrogen 23.09925063
#> 7   banana    normal 13.92850552
#> 8   banana    stress  4.42080670
#> 9   banana  nitrogen  0.08650759
#> 10     tri    normal 36.06980083
#> 11     tri    stress 11.45390192
#> 12     tri  nitrogen 11.98513873
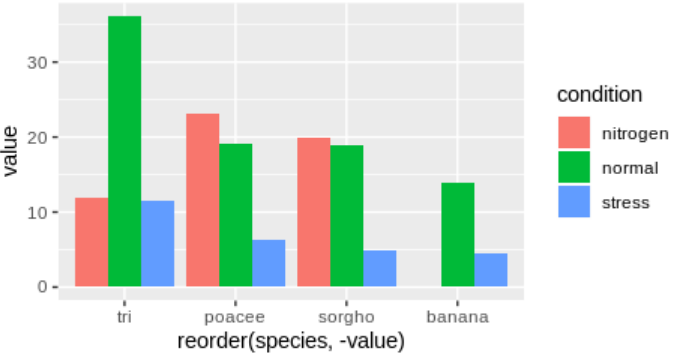
With the dataset above I can create a grouped bar plot with this code:
ggplot(data, aes(x = reorder(species, -value), y = value, fill = condition)) +
    geom_bar(position = "dodge", stat = "identity")
How can I make each individual bar showup on it's own in descending order, by y-value? It would resemble one long pareto chart. The tri/normal would be the first bar. The poacee/nitrogen would be the second bar, and so on. Here's what we're working with now.
I could achieve this by concatinating the species and condition into a new variable, and choosing that as my x-variable. I would prefer a simpler solution, perhaps some argument I can add to geom_bar(). I can't find a suitable argument when searching ?geom_bar(). Is it possible?
[EDIT] - My question is not the same as this SO question. My question seeks to order all individual bars shown above, from first to last. The other SO question seeks to rank the bars only within each subgroup.