There is an example in the Mathematica 7 help for Plot > Options > ColorFunctionScaling.
Table[Plot[Sin[4 Pi x], {x, 0, 1/2}, PlotStyle -> Thick,
  ColorFunction -> Function[{x, y}, Hue[x]],
  ColorFunctionScaling -> cf], {cf, {False, True}}]
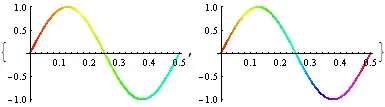
When I evaluate it myself on Mathematica 7, both output plots look like the one on the left.
However, if I evaluate this, I get the plot on the right, as shown above:
Plot[Sin[4 Pi x], {x, 0, 1/2}, PlotStyle -> Thick,
 ColorFunction -> Function[{x, y}, Hue[x]],
 ColorFunctionScaling -> True]
Why might the example as given fail?
Alexey and Simon demonstrated that this is not the result of HoldAll, as I presumed before.
The existence of the example leads me to suspect it once worked, and the information that it works on version 8 tells me that the behavior has changed. What precisely has changed?