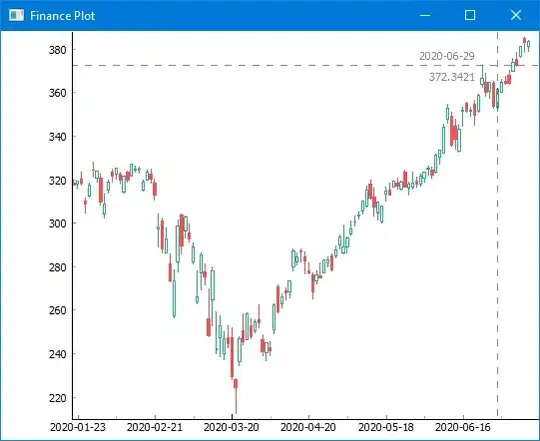
I´m trying to create a simple plot with candlesticks. For that I get the data from Yahoo and plot it using the function candlestick2_ohlc. The goal is to export the image in a jpg file using.
This is the code what I´m using:
from pandas_datareader import data
import matplotlib.pyplot as plt
from mpl_finance import candlestick2_ohlc
import matplotlib.dates as mdates
import fix_yahoo_finance as yf
import datetime

start = datetime.date(2018, 1, 1)
end = datetime.date.today()

aapl = yf.download("AAPL",start,end)
aapl.reset_index(inplace=True)

aapl['Date'] = aapl.index.map(mdates.date2num)

fig, ax = plt.subplots()
plt.xlabel("Date")
plt.ylabel("Price")

candlestick2_ohlc(ax, aapl.Open, aapl.High, aapl.Low, aapl.Close, width=1, colorup='g')
plt.savefig('my_figure.png')
plt.show()
My first question is: there is another simple way to do it? Could you please give me an example to work with finance data? I usually work with quantmod in R.
The second question is: In my example, there is no Date in the X axis. What can I do to show the plot with Dates in the X axis? I should transform the Date into a AX format but I don't know a simple way to do it.