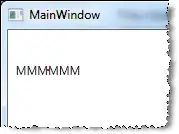
1) I would like to display a vertical line with the "now" value
as well as
2) add a slight margin to the right - Currently "now" events are cropped because there is no space to the right of the last (most recent) event.
UPDATE: thanks to a suggestion in the comments, this is done easily by doing:
maxDate.add(1).hour()
with the fantastic date manipulation library at https://github.com/datejs/Datejs
Desired:
Questions:
how can I retrieve the x value for the "now" value from the svg so I can draw the line?
How can I add a time margin (e.g. 1 hour) or relative margin (e.g. 10%) after the last event?

