I'm trying to run kmeans clustering analysis on a relatively simple data frame. However,
kmeans(sample_data, centers = 4)
doesn't work, as R states there are "NA/NaN/Inf in foreign function call (arg 1)" (not true). Anyway, I tried
kmeans(na.omit(sample_data), centers = 4)
based on the answers here (and other posts), and that didn't work. The only workaround I found was to exclude the non-numeric column (i.e., the observation names) using
kmeans(sample_data[, 2:5], centers = 4)
Unfortunately, this makes the clusters much less informative, since the points now have numbers instead of names. What's going on? Or how could I get the clustering with the right labels?
Edit: I'm trying to reproduce this procedure / result, but with a different data set. Notice that when the author visualizes the clusters, the points are labelled according to the observations (the states, in that case; or "obs1, obs2, etc." in mine.)
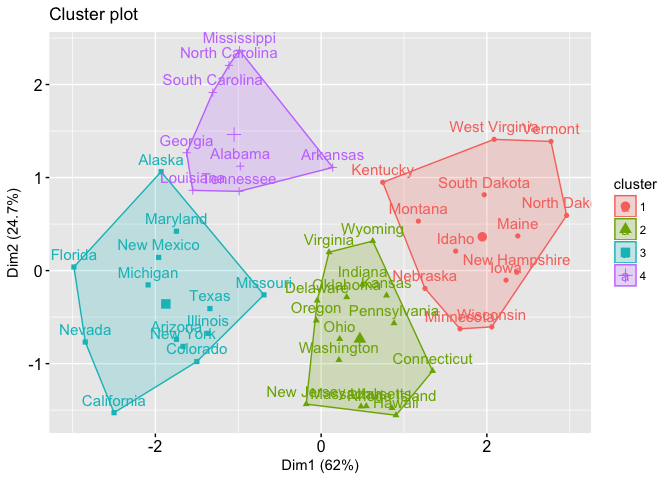
Because of the workaround above (which drops the column with observation names), I get a sequence of numeric labels instead.
Code and dput below:
library(factoextra)
cluster <- kmeans(sample_data, centers = 4) #this doesn't work
cluster <- kmeans(sample_data[, 2:5], centers = 4) #this works
fviz_cluster(cluster, sample_data)
sample_data:
structure(list(name = structure(c(1L, 12L, 19L, 20L, 21L, 22L,
23L, 24L, 25L, 2L, 3L, 4L, 5L, 6L, 7L, 8L, 9L, 10L, 11L, 13L,
14L, 15L, 16L, 17L, 18L), .Label = c("obs1", "obs10", "obs11",
"obs12", "obs13", "obs14", "obs15", "obs16", "obs17", "obs18",
"obs19", "obs2", "obs20", "obs21", "obs22", "obs23", "obs24",
"obs25", "obs3", "obs4", "obs5", "obs6", "obs7", "obs8", "obs9"
), class = "factor"), variable1 = c(0, 0.383966783938484, 0.541654398529028,
0.469060314591266, 0.397636449124337, 0.3944696359856, 0.368740430902284,
0.998695171590958, 0.60013559365688, 0.543416096609665, 1, 0.287523586757021,
0.57818096701751, 0.504722587360754, 0.284825226469556, 0.295250085072615,
0.509782836343032, 0.392942062325636, 0.602608457169149, 0.474668174468815,
0.219951650206242, 0.263837738487209, 0.530976492805559, 0.312401708505963,
0.828799458392802), variable2 = c(0, 0.21094954480341, 0.374890541082605,
0.502470003202637, 0.385212751959443, 0.499052863381439, 0.172887314327707,
0.319869014605517, 0.484308813708282, 0.348608342250238, 0.474464311565186,
0.380406312920036, 1, 0.618253544624658, 0.560290273167607, 0.676315913606924,
0.339157532529115, 0.479005841710258, 0.576094917240369, 0.819742646967549,
0.472559283375261, 0.45594685111211, 0.160720270709769, 0.494360626922513,
0.658705091697224), variable3 = c(0, 0.0391726961740698, 0.157000498692027,
0.194883594782107, 0.133290754949737, 0.199085094994071, 0.000551185924636259,
0.418045152251051, 0.434858475480003, 0.443442199844268, 0.257231662911141,
0.195570389942169, 0.46503468971732, 0.358104620337886, 0.391852363829371,
0.39834809992812, 0.258870156344325, 0.38555892877453, 0.480559759927908,
1, 0.15662554228071, 0.279363773961277, 0.11211821625736, 0.180885222092932,
0.339650099009323), variable4 = c(0, 0.0464395032429444, 0.323768557597659,
0.201813172242373, 0.302710768912681, 0.446027132614423, 0.542018940773003,
1, 0.738123811706962, 0.550819613183929, 0.679555989322392, 0.563126171437818,
0.470328070009844, 0.316069092919459, 0.344421820993065, 0.222931758003036,
0.250406547916021, 0.381098780580988, 0.9526031202384, 0.174161621337361,
0.260548409706516, 0.288399563112687, 0.617089845066814, 0.265314653254406,
0.330637996311329)), class = "data.frame", row.names = c(NA,
-25L))