3

I am trying to optimize a sin/cos approximation function. At its core there is a simple Horner scheme consisting of a bunch of multiplies and adds. Compiler is MSVC from VS2017, processor is Intel Xeon E5-1650, hyperthreading is on (but observations are basically identical if it is off).

Using Intel's VTune Amplifier 2019, I have obtained profiling results (release build, of course) for > 1 min of running the function on random doubles (between -2 pi and 2 pi), with ~40% of clockticks spent in the section shown below (the rest is range reduction + test harness). However, I cannot make sense of the microarchitectural metrics that VTune presents me:
Profiling results (MSVC's source line attribution after inlining is awful.)

Here is the corresponding C++ code that got inlined:

void stableSinCosApproximation(double x, double* sinApprox, double* cosApprox)
{
    double x2 = x * x;
    *sinApprox = x * (sinCoeff[7] + x2 * (sinCoeff[6] + x2 * (sinCoeff[5] + x2 * (sinCoeff[4] + x2 * (sinCoeff[3] + x2 * (sinCoeff[2] + x2 * (sinCoeff[1] + x2 * sinCoeff[0])))))));
    *cosApprox = (cosCoeff[7] + x2 * (cosCoeff[6] + x2 * (cosCoeff[5] + x2 * (cosCoeff[4] + x2 * (cosCoeff[3] + x2 * (cosCoeff[2] + x2 * (cosCoeff[1] + x2 * cosCoeff[0])))))));
}

Clearly, the assembly listing has only one continuous block of instructions. No jumps (and no jump targets), no branching or conditional execution at all. Yet, there are multiple metrics here whose values I cannot make sense of with the information provided by VTune's inbuilt or online help.

Concrete question:

  • The second half of the code has almost no attribution, clockticks and all. Why?

  • The first half has ever-increasing CPI rate. Ok, maybe this and the previous point are due to something about the attribution going wrong, but I don't get it.

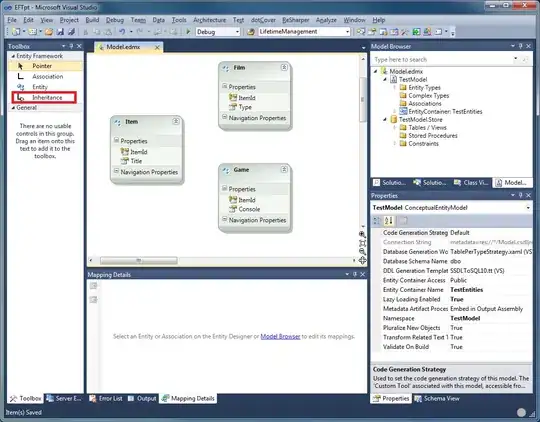
  • The metrics say that there is bad speculation. But upon expanding that column, it shows neither branch mispredicts nor machine clears: enter image description here What is this supposed to tell me? In what capacity does the CPU speculate here?
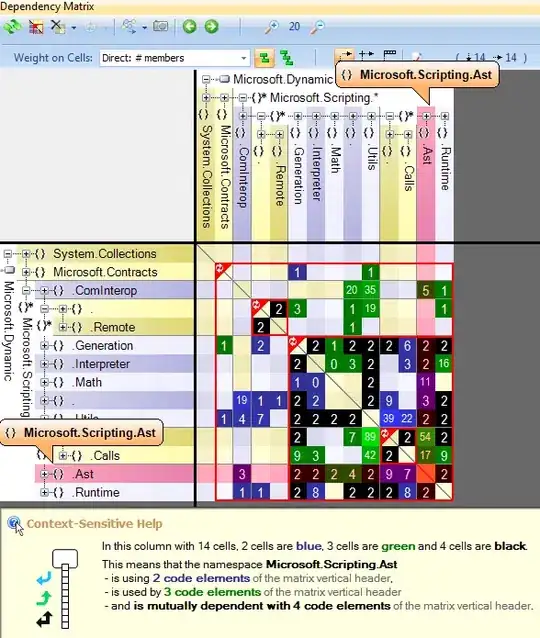
  • I also allegedly lose a good chunk of uops to being front-end bound. Is the correlation to the bad speculation column only coincidence? What should I do with this information? enter image description here
Preemptive notes:

  • The point of reimplementing this is guaranteed consistency across multiple platforms (from the same binary). The inbuilt sin/cos functions can vary by a few ULP across machines, which can kill reproducability of results.

  • Yes, I know about FMAs, but not every platforms that this (single) binary has to run on provides them. I'm not going for run-time dispatches at the moment.

Max Langhof
  • 23,383
  • 5
  • 39
  • 72
  • The bad speculation metric measurement is very small, so it's not really important. The DSB coverage is very low, but it appears that you don't have frontend stalls, so that doesn't matter. However, you seem to have a lot of gray data, which means that VTune has no confidence in them so they are not really reliable. Can you provide more details on the VTune setup you used? Can you reproduce these results? It's not clear to me from the images you showed where the bottleneck is because everything looks good. – Hadi Brais Dec 02 '18 at 07:50
  • Regarding your first question, no data will be attributed to an instruction if no sample was taken at that instruction, so you'll see empty cells. Regarding your third question, my best guess is that this is due to event multiplexing. Regarding your fourth question, can collapse the frontend bound column so I can see whether it's actually frontend bound. I need also to see the backend bound column – Hadi Brais Dec 02 '18 at 08:22
  • Regarding your second question, well, it seems that you have two long dependency chains: one starting at `movsd xmm1, [rip+0x38de]` and one starting at `movsd xmm1, [rip+0x386a]`. These two chains can be executed in parallel though, but only if they were interleaved, which can be done by making them use different registers (such as `xmm2`). – Hadi Brais Dec 02 '18 at 08:31
  • @HadiBrais Thanks for the comments so far! Regarding bad speculation: VTune tells me I lose some 13% to bad speculation. I wouldn't be concerned about that but it stems almost exclusively from that (speculation-free?) section. The results are very much reproducible. I have done another session with "allow multiple runs" to eliminate all multiplexing issues and the results are virtually identical - same lack of data for the second chain, same (partially worse) distributions in the CPI, Retiring, Front-End and Bad Speculation columns. – Max Langhof Dec 03 '18 at 08:45
  • 1
    13% is a lot. But the bad speculation metric from the images you shared don't add up to 13%, so that must be coming from somewhere else. – Hadi Brais Dec 03 '18 at 08:49
  • As for the setup, it's about as "stock" as it could be. Recent VS2017 installation, VTune 2019, Microarchitecture exploration on a test case that runs exclusively the sin/cos function for 20 seconds. I forgot to mention/show this, but the listed section amounts to about 40% of the entire clockticks recorded (the rest is test harness + range reduction). I'll do another run now since the code/binary has changed so I cannot take more screenshots right now. – Max Langhof Dec 03 '18 at 08:49
  • What CPU sampling interval you used? Is it the default 1ms? – Hadi Brais Dec 03 '18 at 08:52
  • @HadiBrais 2 ms (default for the stock uarchitecture exploration I believe). Collection mode is "Detailed" but finalization mode is "Fast" (all default). – Max Langhof Dec 03 '18 at 08:55
  • Let us [continue this discussion in chat](https://chat.stackoverflow.com/rooms/184610/discussion-between-max-langhof-and-hadi-brais). – Max Langhof Dec 03 '18 at 08:55

1 Answers1

0

Can you show screenshots from the VTune's Bottom-up pane instead of assembly pane? It is interesting to see characterization for the whole function (e.g. values of Bad Speculation and Front-End Bound, counts for BR_MISP_RETIRED.ALL_BRANCHES_PS and MACHINE_CLEARS.COUNT events).

rdb77
  • 69
  • 2
  • Yes, see the [chat](https://chat.stackoverflow.com/rooms/184610/discussion-between-max-langhof-and-hadi-brais) for e.g. [this](https://i.stack.imgur.com/DmUzp.png) screenshot. I'd be grateful if you could give an explanation for the number of recovery cycles in particular. – Max Langhof Dec 10 '18 at 17:01