I have a server process implemented in haskell that acts as a simple in-memory db. Client processes can connect then add and retrieve data. The service uses more memory than I would expect, and I'm attempting to work out why.
The crudest metric I have is linux "top". When I start the process I see an "VIRT" image size of ~27MB. After running a client to insert 60,000 data items, I see an image size of ~124MB.
Running the process to capture GC statistics (+RTS -S), I see initially
Alloc    Copied     Live    GC    GC     TOT     TOT  Page Flts
bytes     bytes     bytes  user  elap    user    elap
28296      8388      9172  0.00  0.00    0.00    0.32    0    0  (Gen:  1)
and on adding the 60k items I see the live bytes grow smoothly to
   ...
   532940     14964  63672180  0.00  0.00   23.50   31.95    0    0  (Gen:  0)
   532316      7704  63668672  0.00  0.00   23.50   31.95    0    0  (Gen:  0)
   530512      9648  63677028  0.00  0.00   23.50   31.95    0    0  (Gen:  0)
   531936     10796  63686488  0.00  0.00   23.51   31.96    0    0  (Gen:  0)
   423260  10047016  63680532  0.03  0.03   23.53   31.99    0    0  (Gen:  1)
   531864      6996  63693396  0.00  0.00   23.55   32.01    0    0  (Gen:  0)
   531852      9160  63703536  0.00  0.00   23.55   32.01    0    0  (Gen:  0)
   531888      9572  63711876  0.00  0.00   23.55   32.01    0    0  (Gen:  0)
   531928      9716  63720128  0.00  0.00   23.55   32.01    0    0  (Gen:  0)
   531856      9640  63728052  0.00  0.00   23.55   32.02    0    0  (Gen:  0)
   529632      9280  63735824  0.00  0.00   23.56   32.02    0    0  (Gen:  0)
   527948      8304  63742524  0.00  0.00   23.56   32.02    0    0  (Gen:  0)
   528248      7152  63749180  0.00  0.00   23.56   32.02    0    0  (Gen:  0)
   528240      6384  63756176  0.00  0.00   23.56   32.02    0    0  (Gen:  0)
   341100  10050336  63731152  0.03  0.03   23.58   32.35    0    0  (Gen:  1)
     5080  10049728  63705868  0.03  0.03   23.61   32.70    0    0  (Gen:  1)
This appears to be telling me that the heap has ~63MB of live data. This could well be consistent with numbers from top, by the time you add on stack space, code space, GC overhead etc.
So I attempted to use the heap profiler to work out what's making up this 63MB. The results are confusing. Running with "+RTS -h", and looking at the generated hp file, the last and largest snapshot has:
containers-0.3.0.0:Data.Map.Bin 1820400
bytestring-0.9.1.7:Data.ByteString.Internal.PS  1336160
main:KV.Store.Memory.KeyTree    831972
main:KV.Types.KF_1  750328
base:GHC.ForeignPtr.PlainPtr    534464
base:Data.Maybe.Just    494832
THUNK   587140
All of the other numbers in the snapshot are much smaller than this. Adding these up gives the peak memory usage as ~6MB, as reflected in the chart output:
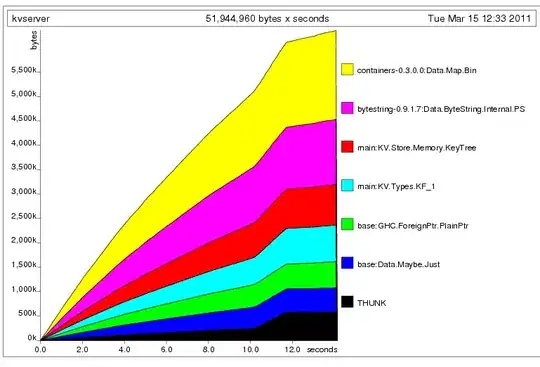
Why is this inconsistent with the live bytes as shown in the GC statistics? It's hard to see how my data structures could be requiring 63MB, and the profiler says they are not. Where is the memory going?
Thanks for any tips or pointers on this.
Tim