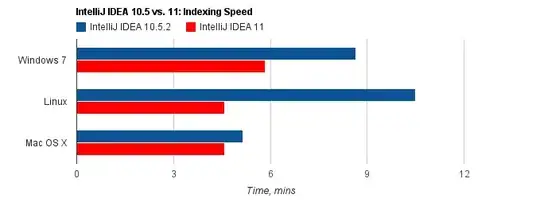
Ok, so a ChartObject has a Chart & ShapeRange member. And a Chart has a ChartArea and PlotArea member:
- What exactly is the Chart member? It say's it "represents" the chart - what does that mean?
- Is the ShapeRange a range the ChartObject holds? And if so, what can be in it? Or is it a parent range that the ChartObject is in?
- The ChartArea says it's the "chart area." What is that?
- The PlotArea says it's the "plot area." What is that?
- This example shows setting a Series.ChartArea but the documentation does not show ChartArea as a Series property. Can ChartArea (and PlotArea) be set in a Series? And if so, what does that mean?
thanks - dave

