i am plotting the attached graph using following script and data set:
set term postscript enhanced color solid
set output "speedup_v1.ps"
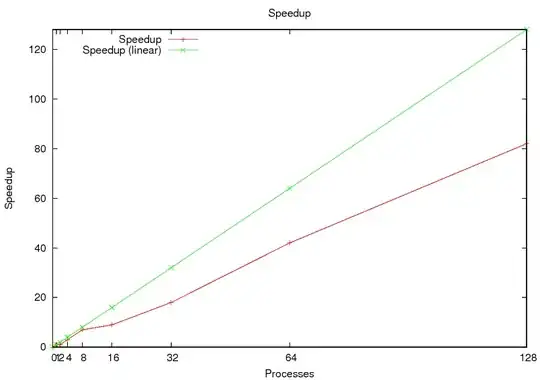
set title "Speedup"
set key left top
set yrange[0:128]
set xtics (0,1,2,4,8,16,32,64,128)
set xlabel 'Processes'
set ylabel 'Speedup'
plot 'speedup_v1.dat' using 1:2 title "Speedup" with linespoints, \
'speedup_v1.dat' using 1:3 title "Speedup (linear)" with linespoints
0 0 0
1 1 1
2 1,692 2
4 3,675 4
8 7,739 8
16 9,840 16
32 18,61 32
64 42,77 64
128 82,43 128
I would like to remain the graph like it is right now but the data points on the x axis should have the same distance between each other. Right now 64p -> 128p eats up half of the screen, i want it to be 1/8. Thanks in advance!