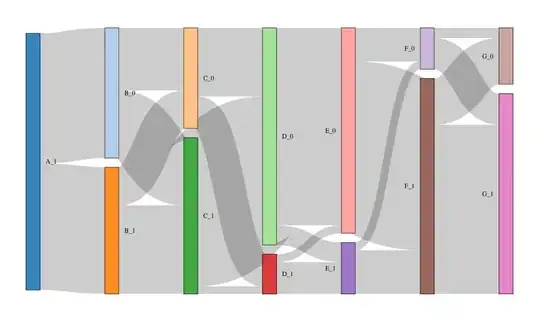
I am having trouble figuring out how to make a sankey plot for data where there are multiple opportunities of success (1) or failure (0). You can generate my sample with the following code:
# example
library(networkD3)
library(tidyverse)
library(tidyr)

set.seed(900)
n=1000
example.data<-data.frame("A" = rep(1,n),
                         "B" = sample(c(0,1),n,replace = T),
                         "C" = rep(NA,n),
                         "D" = rep(NA,n),
                         "E" = rep(NA,n),
                         "F" = rep(NA,n),
                         "G" = rep(NA,n))

for (i in 1:n){
  example.data$C[i]<- ifelse(example.data$B[i]==1,
                                   sample(c(0,1),1,prob = c(0.3,0.7),replace = F),
                                   sample(c(0,1),1,prob = c(0.55,0.45),replace = F))
  example.data$D[i]<-ifelse(example.data$C[i]==1,
                                              sample(c(0,1),1,prob = c(0.95,0.05),replace = F),
                                              sample(c(0,1),1,prob = c(0.65,0.35),replace = F))
  example.data$E[i]<-ifelse(example.data$C[i]==0 & example.data$D[i]==0,
                                    sample(c(0,1),1,prob = c(.9,.1),replace = F),
                                    ifelse(example.data$C[i]==0 & example.data$D[i]==1,
                                           sample(c(0,1),1,prob = c(.3,.7),replace = F),
                                           ifelse(example.data$C[i]==1 & example.data$D[i]==0,
                                                  sample(c(0,1),1,prob = c(.9,.1),replace = F),
                                                  sample(c(0,1),1,prob = c(.1,.9),replace = F))))
  example.data$F[i]<-ifelse(example.data$E==1,
                                         sample(c(1,0),1,prob=c(.85,.15),replace = F),
                                         sample(c(1,0),1,prob = c(.01,.99),replace = F))
  example.data$G[i]<-sample(c(1,0),1,prob = c(.78,.22),replace = F)
}


example.data.1<-example.data%>%
  gather()%>%
  mutate(ORDER = c(rep(0,n),rep(1,n),rep(2,n),rep(3,n),rep(4,n),rep(5,n),rep(6,n)))%>%
  dplyr::select("Event" = key,
                "Success" = value,
                ORDER)%>%
  group_by(ORDER)%>%
  summarise("YES" = sum(Success==1),
            "NO" = sum(Success==0))
The tricky part for me is how I can generate the links data without having to manually specify the source targets and values.
I used the sankey example from this website, and proceeded to muscle my own example data in the least elegant way possible:
links<-data.frame("source" = sort(rep(seq(0,10,1),2)),
           "target" = c(1,2,3,4,3,4,5,6,5,6,7,8,7,8,9,10,9,10,11,12,11,12),
           "value" = c(sum(example.data$A==1 &example.data$B==1), #1
                       sum(example.data$A==1 & example.data$B==0),#2
                       sum(example.data$B==1 & example.data$C==1),#3
                       sum(example.data$B==1 & example.data$C==0),#4
                       sum(example.data$B==0 & example.data$C==1),#5
                       sum(example.data$B==0 & example.data$C==0),#6
                       sum(example.data$C==1 & example.data$D==1),#7
                       sum(example.data$C==1 & example.data$D==0),#8
                       sum(example.data$C==0 & example.data$D==1),#9
                       sum(example.data$C==0 & example.data$D==0),#10
                       sum(example.data$D==1 & example.data$E==1),#11
                       sum(example.data$D==1 & example.data$E==0),#12
                       sum(example.data$D==0 & example.data$E==1),#13
                       sum(example.data$D==0 & example.data$E==0),#14
                       sum(example.data$E==1 & example.data$F==1),#15
                       sum(example.data$E==1 & example.data$F==0),#16
                       sum(example.data$E==0 & example.data$F==1),#17
                       sum(example.data$E==0 & example.data$F==0),#18
                       sum(example.data$F==1 & example.data$G==1),#19
                       sum(example.data$F==1 & example.data$G==0),#20
                       sum(example.data$F==0 & example.data$G==1),#21
                       sum(example.data$F==0 & example.data$G==0)))#22

nodes<-data.frame("name" = names(example.data))


example.list<-list(nodes,links)

names(example.list)<-c("nodes","links")
My problem is this. 1) trying to use this data in the sankeyNetwork function does not actually produce a plot at all, and 2) Obviously this method will be prone to a lot of error especially if there are more than 2 targets per node.
I found an example on stack where the person used the match call in a dplyr::mutate function that looked promising for what I'm trying to accomplish, but the data had a slightly different structure and I did't really know how to get the match call to work with my own data.
The output I'm going for is a sankey plot that shows the number of observations moving between each of the events/outcomes [A:F]. So imagine each of the columns represent an event either successful or not successful. The sakey plot would illustrate a summary of total successes and failures of each event. So all 1000 observations starting at A with 493 going to a node of B = 1, and the remaining 507 going to the node indicating B = 0. Of the 493 in B = 1, 345 go to the node indicating C = 1, and 148 go to the node C = 0. Of the 507 in B = 0 263 go to C = 1 and 244 go to C = 0, and so on for the rest of the event A through F. I hope I've made this clear enough. Any help on this would be greatly appreciated.
