52

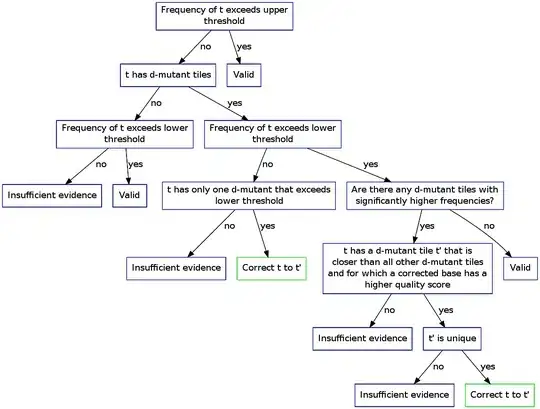
I used the code below to create a graphic using dot (graphviz).

digraph
{
  node [color=Blue,shape=box]

  1.1 [label="Frequency of t exceeds upper threshold"]
  2.1 [label="t has d-mutant tiles"]
  2.2 [label="Valid"]
  3.1 [label="Frequency of t exceeds lower threshold"]
  3.2 [label="Frequency of t exceeds lower threshold"]
  4.1 [label="Insufficient evidence"]
  4.2 [label="Valid"]
  4.3 [label="t has only one d-mutant that exceeds lower threshold"]
  4.4 [label="Are there any d-mutant tiles with significantly higher frequencies?"]
  5.1 [label="Insufficient evidence"]
  node [color=Green] 5.2 [label="Correct t to t'"] node [color=Blue]
  5.3 [label="t has a d-mutant tile t' that is closer than all other d-mutant tiles and for which a corrected base has a higher quality score"]
  5.4 [label="Valid"]
  6.1 [label="Insufficient evidence"]
  6.2 [label="t' is unique"]
  7.1 [label="Insufficient evidence"]
  node [color=Green] 7.2 [label="Correct t to t'"] node [color=Blue]

  1.1 -> 2.1 [label="no"]
  1.1 -> 2.2 [label="yes"]
  2.1 -> 3.1 [label="no"]
  2.1 -> 3.2 [label="yes"]
  3.1 -> 4.1 [label="no"]
  3.1 -> 4.2 [label="yes"]
  3.2 -> 4.3 [label="no"]
  3.2 -> 4.4 [label="yes"]
  4.3 -> 5.1 [label="no"]
  4.3 -> 5.2 [label="yes"]
  4.4 -> 5.3 [label="no"]
  4.4 -> 5.4 [label="yes"]
  5.3 -> 6.1 [label="no"]
  5.3 -> 6.2 [label="yes"]
  6.2 -> 7.1 [label="no"]
  6.2 -> 7.2 [label="yes"]
}

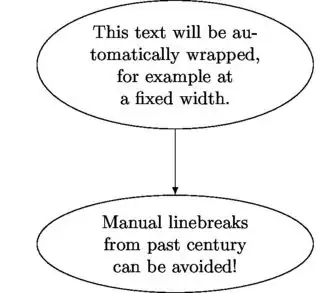
As you can see, some of the boxes in the graphic have a lot of text in the label. I can insert \n characters to make sure the boxes aren't too wide, but I'm wondering if there is a way I can set the width of the boxes and then have the box labels do a hard wrap. Is this possible?
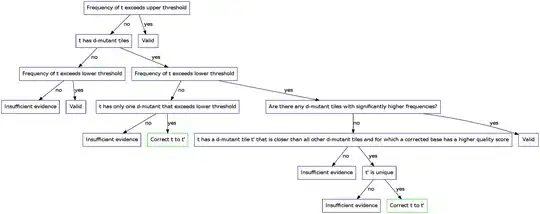
Cœur
  • 37,241
  • 25
  • 195
  • 267
Daniel Standage
  • 8,136
  • 19
  • 69
  • 116
  • Possible duplicate of [Automatic multiline labels in Graphviz?](http://stackoverflow.com/questions/1476432/automatic-multiline-labels-in-graphviz) – tremoloqui Jul 07 '16 at 21:20

4 Answers4

37

graphviz doesn't support automatic line breaks. You have to put the \n in manually.

you can set a width and a height to a node and define it as fixedsized - this will limit the size of the node and draw only as much text as fits into the node

Nikolaus Gradwohl
  • 19,708
  • 3
  • 45
  • 61
6

Although graphviz does not support text wrapping by itself, dot2tex (latex+graphviz) does. The dot2texi latex package gives an all-in-one solution, with (from the users point of view) a single call to a single tool to build the graph.

A short example:

\documentclass{standalone}
\usepackage{dot2texi}
\usepackage{tikz}
\usetikzlibrary{shapes,arrows}
\begin{document}
\begin{dot2tex}[dot]
digraph G {                                             
d2toptions ="--autosize"
node    [lblstyle="text width=10em,align=center"]
a       [texlbl="This text will be automatically wrapped, for example at a fixed width."]
b       [texlbl="Manual linebreaks from past century can be avoided!"]
a -> b
}
\end{dot2tex}                                               
\end{document}

This can be compiled invoking for example: pdflatex --shell-escape myFile.tex, the text will be automatically wrapped at the prescribed fixed width.

As a side note, this tool seems a handy workaround for graphviz' limited typesetting control of the nodes contents.

Ooker
  • 1,969
  • 4
  • 28
  • 58
letax
  • 71
  • 1
  • 3
  • Great answer. Please make sure you have dot2tex installed, or else pdflatex will ask you to do the conversion "by hand". – Stef Joosten Jan 21 '21 at 14:24
  • can this produce svg files? – Ooker Jan 28 '22 at 16:24
  • 1
    @Ooker I don't know, but you should find a solution eg with [tikz calling an external tool](https://tex.stackexchange.com/questions/51757/how-can-i-use-tikz-to-make-standalone-svg-graphics), with [dvisvgm](https://tex.stackexchange.com/questions/51732/latex-outputting-a-tight-svg), with [pdf2svg](https://tex.stackexchange.com/questions/14974/exporting-all-equations-from-a-document-as-individual-svg-files)... – letax Jan 29 '22 at 17:21
  • In your opinion, how do you compare GraphViz with TikZ? – Ooker Jan 29 '22 at 18:29
  • @Ooker Two completely different tools for different tasks... Tikz is a generic language to produce vector graphics. Graphviz is a collection of (very) specialized tools to automate graph layout (without knowing in advance where you want the nodes to sit). Dot2tex allows the use of graphviz' solvers in tikz' flexible framework. – letax Jan 30 '22 at 20:30
  • Hmm, so in Tikz you cannot do graph layout automatically? I thought there should be a library specialized for graph, right? If no, then what is the differences between Tikz and SVG? – Ooker Jan 30 '22 at 21:17
  • @Ooker You might want to post specific questions on the tex.stackexchange side. Here's a first hint for [automatical layout in tikz](https://tex.stackexchange.com/questions/203692/how-to-automatically-draw-a-graph) – letax Feb 01 '22 at 07:20
1

The OP wrote a whole Perl script to achieve this. I found it in his blog: Text wrapping with dot (graphviz).

⚠ Note

This only works if the labels are in the format node [ label=”node label” ]. If the nodes are declared directly (e.g. ”node label”) then it doesn’t work

Perl script:

#!/usr/bin/perl
use strict;
 
my $usage = "setdotlabelwidth [char-width] < [dotfile]";
my $width = shift() or die("Usage: $usage $!");
 
while(<STDIN>)
{
  if(m/label="(.*?)"/)
  {
    my $labeltext = $1;
    my @words = split(/ /, $labeltext);
    my @newtext = ();
    my $newline = "";
    foreach my $word(@words)
    {
      if( length($newline) > 0 and
          length($newline) + length($word) > $width )
      {
        push(@newtext, $newline);
        $newline = "";
      }
      $newline .= " " if( length($newline) > 0 );
      $newline .= $word;
    }
    push(@newtext, $newline) if( length($newline) > 0 );
    my $newlabel = join("\\n", @newtext);
    s/label=".*?"/label="$newlabel"/;
  }
  print;
}

Save this program as setdotlabelwidth, then simply pipe the output into GraphViz. If for example you want to set the width to 35 characters, then the command is:

./setdotlabelwidth 35 < tile-error-correction.dot | dot -Tpng -o tile-error-correction.png

Before: After:

Ooker
  • 1,969
  • 4
  • 28
  • 58
0

Here is a different (perl-less) solution, mentioned in a Graphviz Forum discussion of Graphviz word-wrap (https://forum.graphviz.org/t/text-wrapping-in-graphviz/753).
It only works for record-less and html-less labels (https://gist.github.com/steveroush/4287562c90855fd0d6a991e6159003ce).

sroush
  • 5,375
  • 2
  • 5
  • 11