2

I have some basic questions about gaussian inference.

I have following data:

(Log) dose, Number of animals, Number of deaths
-0.86, 5, 0
-0.30, 5, 1
-0.05, 5, 3
0.73, 5, 5

EDIT: I'm assuming a simple regression model for the dose response logit(θ) = α + βx where logit(θ) = log(θ / (1-θ)). θ stands for a probability of death given dose x.

I want to create a joint normal prior distribution on (α,β), with α ∼ N(0,22),β ∼ N(10,102), and corr(α,β) = 0.5 and then calculate the posterior density in a grid of points around the prior (α: 0 ± 4, β: 10 ± 20).

First, I have created joint normal prior distribution following:

import numpy as np
from scipy import stats
x = np.array([-0.86, -0.30, -0.05, 0.73])
n = np.array([5, 5, 5, 5])
y = np.array([0, 1, 3, 5])
prior = stats.multivariate_normal([0, 10], [[0.5, 0], [0, 0.5]])

Is this right?

Second, how do I calculate posterior density in a grid?

Pörripeikko
  • 839
  • 7
  • 6
  • Yes, and there's plenty of examples for binomial reponses. But what if I want to use gaussian prior? I'm still confused how to calculate posterior. – Pörripeikko Oct 07 '18 at 05:06
  • Now I see my question was indeed incomplete. I'm using a regression model for dose response. I edited the question. – Pörripeikko Oct 08 '18 at 07:02

2 Answers2

1

Parameterizing Gaussian

To answer the first question, you are parameterizing the normal distribution incorrectly. In particular your covariance matrix is not specified according to your description.

Given the standard deviations, s_1 = 22 and s_2 = 102, and the desired correlation of 0.5, the correct covariance matrix is:

 ---                    ---
| s_1*s_1      0.5*s_1*s_2 |
|                          |
| 0.5*s_1*s_2      s_2*s_2 |
 ---                    ---

That is, variances on the diagonal and covariances off the diagonal. In Numpy/Scipy, that would be

mu = np.array([0, 10])
s = np.array([[22, 102]])
Rho = np.array([[1, 0.5], [0.5, 1]])
Sigma = Rho * np.outer(s, s)

prior = stats.multivariate_normal(mean=mu, cov=Sigma)

Computing Grid Values, or Not

Getting an appropriately normalized posterior density requires marginalizing (integrating) over continuous variables (e.g., θ), and this is only analytically solvable in special cases, which I don't think yours is. So, you could either work out the integrals and compute numerical approximations, or use some approximate inference method, such as MCMC or variational inference. There are great tools for this, like PyMC3 and PyStan.

Getting posterior values for only discrete points on a grid requires imposing conditional values on your model variables. However, most probabilistic programming tools are so expressive these days that it's going to be easier to just infer the full posterior, and if you really have some special interest grid values, to inspect them afterward.

PyMC3 Example

Here is a full posterior inference in PyMC3 with your strong prior:

import numpy as np
import pymc3 as pm
import theano
import theano.tensor as tt
import matplotlib.pyplot as plt
import arviz as az

# Data
X = np.array([-0.86, -0.30, -0.05, 0.73])
N = np.array([5, 5, 5, 5])
Y = np.array([0, 1, 3, 5])

# augment X for simpler regression expression
X_aug = tt.stack(np.ones_like(X), X).T

# Prior params
mu = np.array([0, 10])
sd = np.array([22, 102])
Rho = np.array([[1, 0.5],[0.5, 1]])
Sigma = np.outer(sd, sd) * Rho

with pm.Model() as binomial_regression:
    # regression coefficients (strong prior)
    beta = pm.MvNormal('beta', mu=mu, cov=Sigma, shape=2)

    # death probability
    theta_i = pm.Deterministic('theta_i', pm.invlogit(X_aug.dot(beta)))

    # outcomes
    y_i = pm.Binomial('y_i', n=N, p=theta_i, observed=Y)

    trace = pm.sample(10000, tune=100000, target_accept=0.8, random_seed=2018)

This does okay sampling, but requires a high number of tuning steps to reduce divergences:

Auto-assigning NUTS sampler...

Initializing NUTS using jitter+adapt_diag...

Multiprocess sampling (2 chains in 2 jobs) NUTS:

[beta] Sampling 2 chains: 100%|██████████| 220000/220000 [03:52<00:00, 947.57draws/s]

There were 1 divergences after tuning. Increase target_accept or reparameterize.

The number of effective samples is smaller than 25% for some parameters.

Trace Plots

enter image description here

Joint Plot

ax, _, _ = az.jointplot(trace, var_names=['beta'], kind='hexbin')
ax.set_xlabel("Intercept Coefficient ($\\beta_0$)")
ax.set_ylabel("Slope Coefficient ($\\beta_1$)")
plt.show()

enter image description here

merv
  • 67,214
  • 13
  • 180
  • 245
1

Based on merv's good answer, to answer to myself, I think that closed solution is:

p(yi|α,β,ni,xi)∝ [logit−1(α+βxi)]y * [1 − logit−1(α+βx)n−y]

Thus posterior can be calculated following:

import numpy as np
from scipy import optimize, stats
import matplotlib.pyplot as plt
x = np.array([-0.86, -0.30, -0.05, 0.73])
n = np.array([5, 5, 5, 5])
y = np.array([0, 1, 3, 5])

ngrid = 100
mu_1, mu_2, sd_1, sd_2 = 0, 10, 2**2, 10**2
A = np.linspace(-4, 4, ngrid)
B = np.linspace(-10, 30, ngrid)

mu = np.array([0, 10])
s = np.array([[22, 102]])
Rho = np.array([[1, 0.5], [0.5, 1]])
Sigma = Rho * np.outer(s, s)
prior = stats.multivariate_normal([mu_1, mu_2], Sigma)

def prop_likelihood(input_values):
    ilogit_abx = 1 / (np.exp(-(input_values[...,0][...,None]*np.ones(x.shape) + input_values[...,1][...,None] * x)) + 1)
    return np.prod(ilogit_abx**y * (1 - ilogit_abx)**(n - y), axis=ilogit_abx.ndim -1)

grid_a , grid_b = np.meshgrid(A,B)
grid = np.empty(grid_a.shape + (2,)) 
grid[:, :, 0] = grid_a
grid[:, :, 1] = grid_b

posterior_density = prior.pdf(grid)*prop_likelihood(grid)

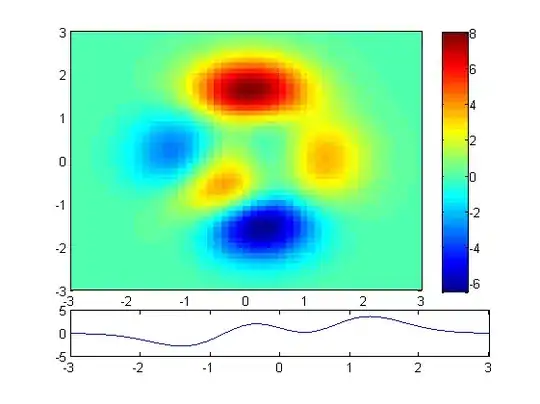
Which then can be illustrated:

fig, ax = plt.subplots(figsize=(10, 5)
ax.imshow(
    posterior_density,
    origin='lower',
    aspect='auto',
    extent=(A[0], A[-1], B[0], B[-1])
)
ax.set_xlim([-4, 4])
ax.set_ylim([-10, 30])
ax.set_xlabel(r'$\alpha$')
ax.set_ylabel(r'$\beta$')
ax.set_title('Posterior heatmap')
ax.grid('off')

posterior density heatmap

Analytical solution:

def opt(params):
    a, b  = params[0], params[1]
    z = np.exp(a + b * x) / (1 +  np.exp(a + b * x))
    e = - np.sum(y * np.log(z) + (n - y) * np.log(1 - z))
    return e

optim_res = optimize.minimize(opt, np.array([0.0, 0.0]))
mu_opt = optim_res['x']
sigma_opt = optim_res['hess_inv']
posterior_optimized = stats.multivariate_normal(mean=mu_opt, cov=sigma_opt)

Which can then be plotted

fig, ax = plt.subplots(figsize=(10, 5)
ax.imshow(
    posterior_optimized.pdf(grid),
    origin='lower',
    aspect='auto',
    extent=(A[0], A[-1], B[0], B[-1])
)
ax.set_xlim([-4, 4])
ax.set_ylim([-10, 30])
ax.set_xlabel(r'$\alpha$')
ax.set_ylabel(r'$\beta$')
ax.set_title('Posterior heatmap from analytical solution')
ax.grid('off')

analytically solved posterior

There are some differences. Not sure if analytical optimization function is correct.

Hopefully this helps others.

merv
  • 67,214
  • 13
  • 180
  • 245
Pörripeikko
  • 839
  • 7
  • 6
  • 1
    (1) to inline images add a "!" (see edited markdown); (2) inverse logit is defined in SciPy [`scipy.special.expit`](https://docs.scipy.org/doc/scipy-0.15.1/reference/generated/scipy.special.expit.html), and your `y*log(1-x)` ops can be done with some of [the SciPy convenience functions](https://docs.scipy.org/doc/scipy-0.15.1/reference/special.html#convenience-functions) which provide numerical stability; (3) be aware you are only computing an unnormalized posterior function, not a true posterior probability density – merv Oct 11 '18 at 16:58
  • To comment on what you call the analytical solution: if I understand correctly, you're fitting a Gaussian, which your true posterior really isn't. This technique is called Laplace approximation and while it minimizes the error of the inferred mean and variance, it won't capture the true posterior's higher moments, like skew and kurtosis. Just be aware that this approach has that limitation. I think this can explain why we see a difference between your plots. – merv Oct 27 '18 at 02:58