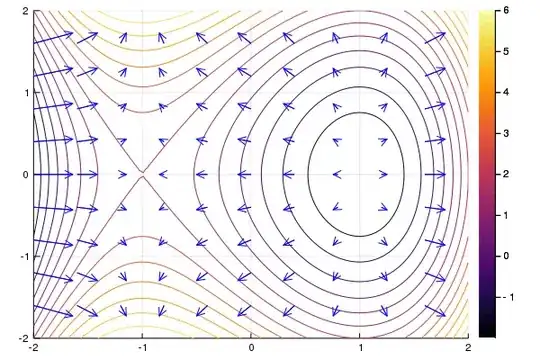
I'm new on Julia and I've tried to make the code of following post How to plot a vector field in Julia?, but, didn't work, so, I would like to know if it's possible to plot with the package "Plots" and how? It'll be very important to my research.
P.s.: Someone gave to me the following code, but, actually, I don't know why isn't working:
using Plots
gr(size=(600,400))

function example()
  X = linspace(-2, 2, 100)
  Y = linspace(-2, 2, 100)
  f(x, y) = x^3 - 3x + y^2
  contour(X, Y, f)

  x = linspace(-2, 2, 11)
  y = linspace(-2, 2, 11)
  df(x, y) = [3x^2 - 3; 2y] / 25
  quiver!(x, y', quiver=df, c=:blue)

  xlims!(-2, 2)
  ylims!(-2, 2)
  png("example")
end

example()

