-2

When I try to run the following code I get an error:

value <- as.matrix(wsu.wide[, c(4, 3, 2)])

Error in [.data.frame(wsu.wide, , c(4, 3, 2)) : undefined columns selected

How do I get this line of work? It's part of dcasting my data.

This is full the code:

library(readxl)
library(reshape2)

Store_and_Regional_Sales_Database <- read_excel("~/Downloads/Data_Files/Store and Regional Sales Database.xlsx", skip = 2)
store <- Store_and_Regional_Sales_Database
freq <- table(store$`Sales Region`)
freq
rel.freq <- freq / nrow(store)
rel.freq
rel.freq.scaled <- rel.freq * 100
rel.freq.scaled
labs <- paste(names(rel.freq.scaled), "\n", "(", rel.freq.scaled, "%", ")", sep = "")
pie(rel.freq.scaled, labels = labs, main = "Pie Chart of Sales Region")

monitor <- store[which(store$`Item Description` == '24" Monitor'),]
wsu <- as.data.frame(monitor[c("Week Ending", "Store No.", "Units Sold")])

wsu.wide <- dcast(wsu, "Store No." ~ "Week Ending", value.var = "Units Sold")
value <- as.matrix(wsu.wide[, c(4, 3, 2)])

Thanks.

Edit:

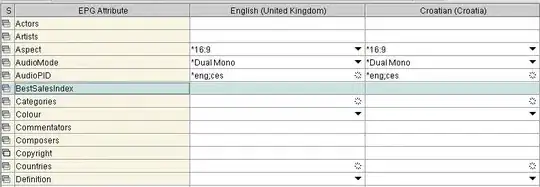
This is my table called "monitor":

24" Monitor picture

When I then make this wsu <- as.data.frame(monitor[c("Week Ending", "Store No.", "Units Sold")]) I create another vector with only variables "Week Ending", "Store No." and "Units Sold".

However, as I write the wsu.wide code the ouput I get is only this:

wsu.wide

Why do I only get this small table when I'm asking to dcast my data?

After this I don't get what is wrong.
Artem
  • 3,304
  • 3
  • 18
  • 41
aleksa
  • 1
  • 2
  • 1
    Hello Aleksa. Welcome to Stackoverflow. Please read [How to Create a Minimal, Complete, and Verifiable Example](https://stackoverflow.com/help/mcve) and update your post. – Len Greski Sep 14 '18 at 10:38
  • The error is clearly saying that you are selecting undefined columns, i.e. these columns don't exist. Check your syntax again. – user2974951 Sep 14 '18 at 10:50
  • It is hard to tell but it looks like this line is missing a comma wsu <- as.data.frame(monitor[c("Week Ending", "Store No.", "Units Sold")]) – CAWA Sep 14 '18 at 14:36
  • @aleksa, it is better not to put images to your post, as it is discouraged. But put the result of `dput(head(monitor, 17))` function. – Artem Sep 25 '18 at 20:18

1 Answers1

0

The problem is at the line: wsu.wide <- dcast(wsu, "Store No." ~ "Week Ending", value.var="Units Sold") Instead of the double quotation mark " you should use the grave accent - ` in the formula:

wsu.wide <- dcast(wsu, `Store No.` ~ `Week Ending`, value.var = "Units Sold")

To avoid this kind of problem it is better not to use spaces in the R object names it is better to substitute Sales Region variable name to sales_region using underscore. See e.g. Google's R Style Guide.

Please see the code below, I used simulation of your data as extract it from the picture is quite cumbersome:

library(readxl)
library(reshape2)

#simulation
n <- 4
Store_and_Regional_Sales_Database <- data.frame(
  a = seq_along(LETTERS[1:n]),
  sr = LETTERS[1:n],
  sr2 = '24" Monitor',
  sr3 = 1:4,
  sr4 = 2:5,
  sr5 = 3:6)

names(Store_and_Regional_Sales_Database)[2:6] <- c(
  "Sales Region", "Item Description",
  "Week Ending", "Store No.", "Units Sold")

# algorithm
store <- Store_and_Regional_Sales_Database
freq <- table(store$`Sales Region`)
freq
rel.freq <- freq/nrow(store)
rel.freq
rel.freq.scaled <- rel.freq * 100
rel.freq.scaled
labs <- paste(names(rel.freq.scaled), "\n", "(", rel.freq.scaled, "%", ")", sep = "")
pie(rel.freq.scaled, labels = labs, main = "Pie Chart of Sales Region")

monitor <- store[which(store$`Item Description` == '24" Monitor'),]
wsu <- as.data.frame(monitor[c("Week Ending", "Store No.", "Units Sold")])

wsu.wide <- dcast(wsu, `Store No.` ~ `Week Ending`, value.var = "Units Sold")
value <- as.matrix(wsu.wide[ ,c(4,3,2)])

Output:

      3  2  1
[1,] NA NA  3
[2,] NA  4 NA
[3,]  5 NA NA
[4,] NA NA NA
Artem
  • 3,304
  • 3
  • 18
  • 41