-1

I have a flat table like this,

R#  Cat SWN CWN CompBy  ReqBy   Department
1   A   1   1   Team A  Team B  Department 1
2   A   1   3   Team A  Team B  Department 1
3   B   1   3   Team A  Team B  Department 1
4   B   2   3   Team A  Team C  Department 1
5   B   2   3   Team D  Team C  Department 2
6   C   2   2   Team D  Team C  Department 2

R# indicates the RequestNumber, Cat# indicates the Category, SWN indicates the Submitted Week Number, CWN indicates the Completed Week Number, CompBy indicates Completed By, ReqBy Indicates Requested By, Department Indicates Department Name,

I would like to create a data model that avoids ambiguity and at the same time allows me to report on Category, SWN, CWN (needs to be only a week number), CompBY, ReqBy, Department through a single filter.

For example, the dashboard will have a single filter choice to select a week number.If that week number is selected, it will show the details of these requests from submitted and completed week number. I understand this requires the creation of a calendar table or something like that.

I am looking for a data-model that explains the cardinality and direction(Single or both). If possible, kindly post the PBIX file and repost the link here.

What I have tried: Not able to establish one of the four connections Unable to Create one of the four relationships
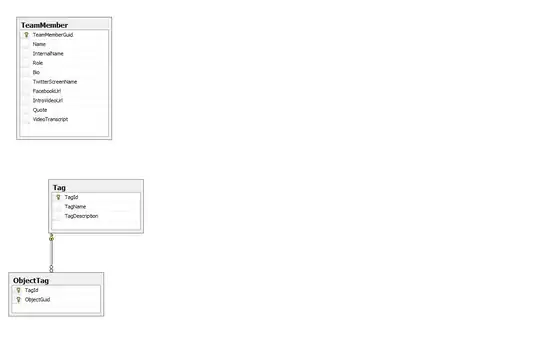
Update: Providing a bounty for this question because I would like to see how does the Star schema will look like for this flat table.

One of the reason I am looking for a star schema over a flat table is - For example, a restaurant menu is a dimension and the purchased food is a fact. If you combined these into one table, how would you identify which food has never been ordered? For that matter, prior to your first order, how would you identify what food was available on the menu?
Cœur
  • 37,241
  • 25
  • 195
  • 267
  • Why is this question down-voted and opted for close?. A lot has been asked on a single question. But considering the fact that this is a common problem that many faces in PowerBI ( who has no experience in Data Modelling, Cardinality and direction concepts ). This is also a question which has not been addressed related to PowerBI in this site. Please educate me on this one. – Student of the Digital World Aug 09 '18 at 15:32
  • For one, I'm not sure what you are asking. If you have multiple slicers on the page with your data, the slicers interact (by default) and update the choices available. What is not working for your instance? – Degan Aug 09 '18 at 15:45
  • @Degan I know what you are saying. But, it will fail to work when I have to select a single week number and report on what has been submitted on that week number and what has been completed on that week number. The expected result when I select Week Number 1 is - it should show 3 submitted, but only one completed on that week. – Student of the Digital World Aug 09 '18 at 15:49
  • So, you want to summarize the activity for each week? If so, then you will need a pivot report. If not, if you slicer on SWN=1, then you will see 3 rows. – Degan Aug 09 '18 at 17:38
  • @Degan - Yes exactly! A pivot report is what I am trying to do here. – Student of the Digital World Aug 09 '18 at 18:07
  • @Sid29 - I am struggling to understand your problem. What prevents you from creating the reports you've described? You don't need any relationships for this table. Just create the needed visuals and set their desired interaction mode. – RADO Aug 09 '18 at 18:21
  • @RADO I will update the question with my problem tomorrow explained with a detailed example. Thanks. – Student of the Digital World Aug 09 '18 at 18:23
  • @Sid29 - my only guess is that (maybe) you are asking how to convert this table into a star schema, but that's a very different problem - you don't need it for the stated objectives. – RADO Aug 09 '18 at 18:28
  • @Rado Yes definitely I am looking for a schema here. Without, the schema then I won’t be able to have a single week number to select that reports on both the Submitted and Completed Week numbers. A common week number is necessary because if I just putting SWN as my week number that would return 3 completed but it should return 3 as submitted but 1 as completed. Ideally there will be a need for self join here as well. – Student of the Digital World Aug 09 '18 at 18:33

1 Answers1

1

The scope of your question is rather unclear, so I'm just addressing this part of the post:

the dashboard will have a single filter choice to select a week number. If that week number is selected, it will show the details of these requests from submitted and completed week number.


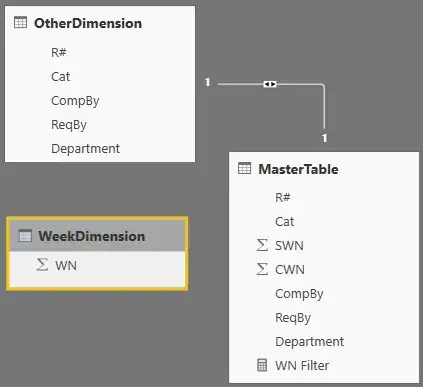
One way to get OR logic is to use a disconnected parameter table and write your measures using the parameters selected. For example, consider this schema:

Diagram

If you put WN on a slicer, then you can write a measure to filter the table based on the number selected.

WN Filter = IF(COUNTROWS(
                INTERSECT(
                    VALUES(WeekDimension[WN]),
                    UNION(
                        VALUES(MasterTable[SWN]),
                        VALUES(MasterTable[CWN])))) > 0, 1, 0)

Then if you use that measure as a visual level filter, you can see all the records that correspond to your WN selection.

Measure Filter


If you can clarify your question to more closely approach a mcve, then you'll likely get better responses. I can't quite determine the specific idea you're having trouble with.

Alexis Olson
  • 38,724
  • 7
  • 42
  • 64