I was trying to simulate "Sampling Distribution of Sample Proportions" using Python. I tried with a Bernoulli Variable as in example here
The crux is that, out of large number of gumballs, we have yellow balls with true proportion of 0.6. If we take samples (of some size, say 10), take mean of that and plot, we should get a normal distribution.
I have managed to obtain the sampling distribution as normal, however, the actual normal continuous curve with same mu and sigma, does not fit at all, but scaled to few factors up. I am not sure what is causing this, ideally it should fit perfectly. Below is my code and output. I tried varying the amplitude and also sigma (dividing by sqrt(samplesize)) but nothing helped. Kindly help.
Code:
from SDSP import create_bernoulli_population, get_frequency_df
from random import shuffle, choices
from bi_to_nor_demo import get_metrics, bare_minimal_plot
import matplotlib.pyplot as plt


N = 10000  # 10000 balls
p = 0.6    # probability of yellow ball is 0.6, and others (1-0.6)=>0.4
n_pickups = 10       # sample size
n_experiments = 2000  # I dont know what this is called


# STATISTICAL PDF
# choose sample, take mean and add to X_mean_list. Do this for n_experiments times.
X_hat = []
X_mean_list = []
for each_experiment in range(n_experiments):
    X_hat = choices(population, k=n_pickups)  # choose, say 10 samples from population (with replacement)
    X_mean = sum(X_hat)/len(X_hat)
    X_mean_list.append(X_mean)
stats_df = get_frequency_df(X_mean_list)


# plot both theoretical and statistical outcomes
fig, ax = plt.subplots(1,1, figsize=(5,5))
from SDSP import plot_pdf
mu,var,sigma = get_metrics(stats_df)
plot_pdf(stats_df, ax, n_pickups, mu, sigma, p=mu, bar_width=round(0.5/n_pickups,3),
         title='Sampling Distribution of\n a Sample Proportion')
plt.tight_layout()
plt.show()
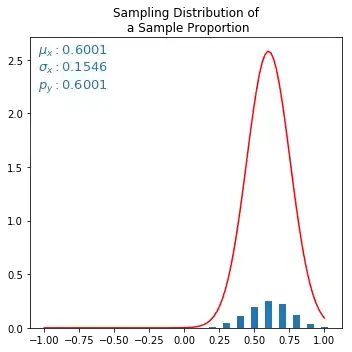
Output:
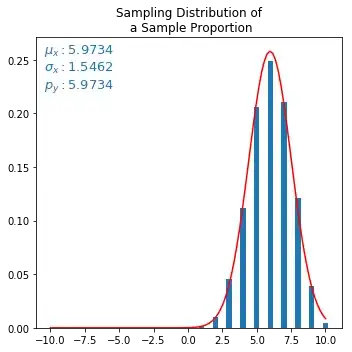
Red curve is the misfit normal approximation curve. The mu and sigma is derived from statistical discrete distribution (small blue bars), and fed to formula calculating normal curve. But normal curve looks scaled up somehow.
Update:
Avoiding a division to take average, solves the graph issue but mu is scaled. So issue is still not fully solved yet. :(
X_mean = sum(X_hat) # removed the division /len(X_hat)
Output after removing above division (but its needed?):