4

Consider the following code:

from datetime import datetime as dt
from bokeh.io import output_file, show
from bokeh.plotting import figure
from bokeh.models import ColumnDataSource

output_file("plot_dates.html")

p = figure(x_axis_type='datetime')

data = dict(
    dates=[dt(2015, 1, 1), dt(2015, 1, 2), dt(2015, 1, 3)],
    values=[1,2,3])
source = ColumnDataSource(data)

p.line('dates', 'values', source=source)

show(p)

This displays a line correcty. If now I want to skip a point, e.g. the second I had hoped that setting an element either in dates or in values (or in both), would result in a point being skipped. Unfortunately, that is not the case, but None is displayed as it was "0", which translates to 1970-01-01 in the case of the dates. Is there a simple way to skip data or must this be done by hand (or through a separate library)?

I know this could be done more or less easily using pandas for filtering out the rows/columns containing None elements, but I cannot use that.
2 Answers2

5

Depending on what you mean, you can do this with NaN values, not None. But you will have to use NumPy, both for np.nan and also to ensure that the arrays are properly encoded to be able to transmit NaN values into the browser.

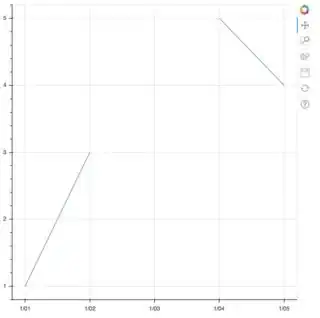
Additionally, you'll need more points. When line data has a NaN value in it, the segments on both sides are skipped, so with only three points, nothing will be drawn at all, because there are no complete segments anywhere. With five points you can see:

import numpy as np
from datetime import datetime as dt
from bokeh.io import output_file, show
from bokeh.plotting import figure
from bokeh.models import ColumnDataSource

output_file("plot_dates.html")

p = figure(x_axis_type='datetime')

data = dict(
    dates=[dt(2015, 1, 1), dt(2015, 1, 2), dt(2015, 1, 3), dt(2015, 1, 4), dt(2015, 1, 5)],
    values=np.array([1.0, 3.0, np.nan, 5.0, 4.0]))
source = ColumnDataSource(data)

p.line('dates', 'values', source=source)

show(p)

enter image description here

EDIT: This could also be accomplished with a CDSView without needing to put any NaN values in:

view = CDSView(source=source, filters=[IndexFilter([0, 1, 3, 4])]) 
p.line('dates', 'values', source=source, view=view)

It's not clear from your question what you mean by "skip" though. If you mean is there a way to draw the line simply as if the point was not there at all, i.e. without the interruption above that NaN or a filter gives, then the answer is "no". You will need to pre-filter your data.

bigreddot
  • 33,642
  • 5
  • 69
  • 122
  • Upvoted, but does not show up. That is exactly what I was looking for, thanks! –  Jul 27 '18 at 22:17
-1

Why not just delete the data you don't want? It doesn't require any package

data = dict(dates=[dt(2015, 1, 1), dt(2015, 1, 2), dt(2015, 1, 3)], values=[1,2,3])

# remove the 1st date 
dates2 = data['dates']
values2 = data['values']
del dates2[1]
del values2[1]
data2 = dict(dates=dates2,values=values2) 
# this should be the dict from before without the 1st date and 1st value

You could write a function to delete the nth date.

def deldate(n,data):

    dates2 = data['dates']
    values2 = data['values']
    del dates2[n]
    del values2[n]
    data2 = dict(dates=dates2,values=values2) 
    return data2
kevinkayaks
  • 2,636
  • 1
  • 14
  • 30
  • This answer is bad in two ways: (1) this is precisely what OP is trying to avoid; (2) even in such cases, deleting the point is just a very rough way of doing so, and masking after conversion to Numpy array would be a much cleaner approach. – norok2 Jul 28 '18 at 08:18