12

I am trying to simulate a t-copula using Python, but my code yields strange results (is not well-behaving):

I followed the approach suggested by Demarta & McNeil (2004) in "The t Copula and Related Copulas", which states:
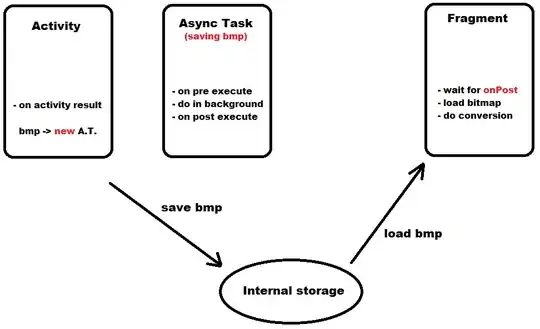
t copula simulation

By intuition, I know that the higher the degrees of freedom parameter, the more the t copula should resemble the Gaussian one (and hence the lower the tail dependency). However, given that I sample from scipy.stats.invgamma.rvs or alternatively from scipy.stats.chi2.rvs, yields higher values for my parameter s the higher my parameter df. This does not made any sense, as I found multiple papers stating that for df--> inf, t-copula --> Gaussian copula.

Here is my code, what am I doing wrong? (I'm a beginner in Python fyi).

import numpy as np
import pandas as pd
import matplotlib.pyplot as plt
from scipy.stats import invgamma, chi2, t

#Define number of sampling points
n_samples = 1000
df = 10

calib_correl_matrix = np.array([[1,0.8,],[0.8,1]]) #I just took a bivariate correlation matrix here
mu = np.zeros(len(calib_correl_matrix))
s = chi2.rvs(df)
#s = invgamma.pdf(df/2,df/2) 
Z = np.random.multivariate_normal(mu, calib_correl_matrix,n_samples)
X = np.sqrt(df/s)*Z #chi-square method
#X = np.sqrt(s)*Z #inverse gamma method

U = t.cdf(X,df)

My outcomes behave exactly oppisite to what I am (should be) expecting: Higher df create much higher tail-dependency, here also visually:

 U_pd = pd.DataFrame(U)
 fig = plt.gcf()
 fig.set_size_inches(14.5, 10.5)
 pd.plotting.scatter_matrix(U_pd, figsize=(14,10), diagonal = 'kde')
 plt.show()

df=4: scatter_plot

df=100: enter image description here

It gets especially worse when using the invgamma.rvs directly, even though they should yield the same. For dfs>=30 I often receive a ValueError ("ValueError: array must not contain infs or NaNs")

Thank you very much for your help, much appreciated!

KT.
  • 10,815
  • 4
  • 47
  • 71
rhonsprudel
  • 121
  • 1
  • 5
  • can you provide the code that you can replicate? you are missing the imports, hard to guess what is `chi2.rvs`? – Evgeny Jul 26 '18 at 11:18
  • Sure: `import numpy as np`, `import pandas as pd`, `from scipy.stats import invgamma`, `from scipy.stats import chi2`, `import matplotlib.pyplot as plt` thank you very much for your help! – rhonsprudel Jul 26 '18 at 11:56
  • and `U = sc.stats.t.cdf(X,df)` is...? – Evgeny Jul 26 '18 at 13:18
  • `sc.stats` = `scipy.stats` – rhonsprudel Jul 26 '18 at 13:24
  • I have a vague guess `t_m `and `t_v` are not accounted in code as different. Should they? – Evgeny Jul 26 '18 at 13:56
  • Basically, `X`is the simulated `t_m` and then to generate `U` the matrix X is plugged into `t_v` in my code. You suggest to insert `X_i` elementwise into respective `t_v`? – rhonsprudel Jul 26 '18 at 14:04
  • I'm missing what `m` is in `t_m` in point 1. – Evgeny Jul 26 '18 at 14:07
  • `t_m` is a multivariate Student t distribution, while `t_v` is the univariate marginal cdf. The dimension of `t_m` is given by the correlation matrix (here 2x2 -> two-dimensional), – rhonsprudel Jul 26 '18 at 14:15
  • For U are you sure it it cdf, not pdf? – Evgeny Jul 26 '18 at 19:52
  • Yes, because the copula works in the [0,1]^d space and out of it you generate a vector, which later on reflects the y-axes of the underlying univariate CDFs for each series. A pdf would not depict in [0,1] but rather a space much smaller than 1 – rhonsprudel Jul 26 '18 at 20:56
  • Maybe cross-post to https://stats.stackexchange.com/questions/tagged/copula? Your question begs for proper answer! – Evgeny Jul 27 '18 at 05:11
  • Have done that! Thanks! https://stats.stackexchange.com/questions/359297/simulation-of-t-copula-in-python – rhonsprudel Jul 27 '18 at 07:15
  • If that does not work for some reason, I can repost later with a bounty - which possibly can attract more answeres. – Evgeny Jul 27 '18 at 11:33
  • That would be awesome! Thanks! – rhonsprudel Jul 27 '18 at 12:29
  • Hi, so far nobody reacted to it unfortunately - could you repost it? :) – rhonsprudel Jul 31 '18 at 15:01
  • I used a bounty to attract readers, but to no success. The points from a bounty were gone, even without an answer! Can you drop me a line at my email or twitter? – Evgeny Aug 15 '18 at 12:12
  • @rhonsprudel: are you still interested in tracking this down? Because some tests I've done suggest there's nothing really wrong here. – DSM Sep 23 '18 at 00:12

1 Answers1

2

There is one obvious problem in your code. Namely, this:

s = chi2.rvs(df)

Has to be changed to something like that:

s = chi2.rvs(df, size=n_samples)[:, np.newaxis]

Otherwise the variable s is just a single constant and your X ends up being a sample from the multivariate normal (scaled by np.sqrt(df/s)), rather than the t-distrubution that you need.

You most probably obtained your "tail-heavy" charts simply because you were unlucky and your sampled value of s ended up being too small. This has nothing to do with df, though, yet it seems that it is easier to hit the "unlucky" values when df is smaller.

KT.
  • 10,815
  • 4
  • 47
  • 71