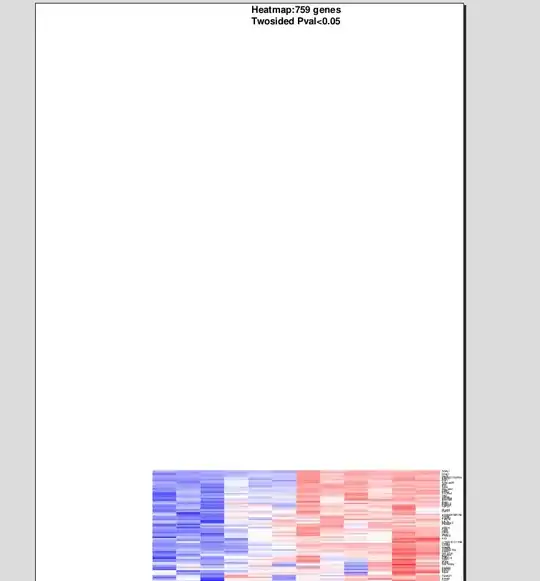
I've been trying to change the size of the labels on my x and y axes of a graph drawn using plot_ly in R.
Below is my code:
q <- plot_ly(
    x=colnames(avg_exp_norm),
    y=row.names(avg_exp_norm),
    z = avg_exp_norm, type = "heatmap") %>%
    layout(xaxis = list(size = 15), yaxis = list(size = 5))
q
But it doesn't work and in the result I don't see any changes in font size.
What I'm doing wrong and how can I fix it?
