89

I'm working on a Flutter app using Android Studio as my IDE. I'm attempting to write tests and check the code coverage but I can't work out how to view the data in the IDE or any other application.

By running flutter test --coverage, a coverage report seems to be generated into a file /coverage/lcov.info. That file looks something like this:

SF:lib\data\Customer.g.dart
DA:9,2
DA:10,2
DA:11,2
DA:12,2
DA:13,2
DA:20,0
DA:21,0
DA:22,0
DA:23,0
DA:24,0
...

Looking at the file it seems to have a list of my project files with line by line coverage data. Is there a way to view this information in Android Studio?

Philippe Fanaro
  • 6,148
  • 6
  • 38
  • 76

11 Answers11

125

You can also install lcov and convert the lcov.info file to HTML pages and then see the result in the browser with sorting option.

1. Installation

1.1. Installing in Ubuntu

sudo apt-get update -qq -y
sudo apt-get install lcov -y

1.2. Installing in Mac

brew install lcov

2. Run tests, generate coverage files and convert to HTML

flutter test --coverage
genhtml coverage/lcov.info -o coverage/html

3. Open coverage report in browser

open coverage/html/index.html

Note This way you can add it to circleci artifacts and coveralls as well.

Khamidjon Khamidov
  • 6,783
  • 6
  • 31
  • 62
Jak
  • 2,893
  • 3
  • 19
  • 33
14

This is what you want to run to see tests coverage in your browser on macOS

flutter test --coverage
genhtml coverage/lcov.info -o coverage/html
open coverage/html/index.html
Adam Smaka
  • 5,977
  • 3
  • 50
  • 55
  • 1
    if you see the error: `zsh: command not found: genhtml` run: `brew install lcov` then you can re-run the second and third commands. – nelsonic Mar 30 '23 at 20:15
12

You can view the code coverage generated by flutter with the Atom editor.
You just need to install the Dart and lcov-info packages.

Then you load your project folder and press Ctrl+Alt+c, coverage will be displayed with a summary of the whole projects coverage and also with specific line highlighting.

There doesn't appear to be any plugin for Android studio which does this as of yet.

cokeman19
  • 2,405
  • 1
  • 25
  • 40
  • can you give a picture to me. I have loaded the project but ctrl+alt+c didn't work. – byhuang1998 Nov 25 '20 at 08:56
  • The [Flutter Enhancement Suite](https://github.com/marius-h/flutter_enhancement_suite) plugin for Android Studio/IntelliJ does this, now. See my answer for more details on what the plugin does and how to use it. I found the plugin reading [this flutter issue](https://github.com/flutter/flutter-intellij/issues/718#issuecomment-817122534) on how to display coverage reports. – Kim Jun 23 '21 at 09:41
12

Update 9/18/2021:

See new answer for how it's done within the editor

Update 5/9/2020:

Turns out you can just run flutter test --coverage, then in the same terminal session run bash <(curl -s https://codecov.io/bash) -t token token should be the repository token you get from CodeCov. That command should automatically find and upload the coverage data and will be visible on your CodeCov dashboard. So you don't need Bitrise.

Original:

I've been using Bitrise for continuous integration on my flutter project and there is an easy way to send your reports to CodeCov then visualize it there. This requires you to gain some knowledge on how to set up and use Bitrise but a lot of its automatic so don't worry, also if you're a small team you should be fine with the free tier. Here are the key points for getting CodeCov to work.

  1. Make sure you add the --coverage variable to the Flutter Test workflow.

Bitrise coverage variable example

  1. Add the token from CodeCov as a secret key, you will need to sign up for CodeCov and link your repository to receive a token.

Bitrise secret key example

  1. Add the CodeCov workflow and select the CODECOV_TOKEN key.

Bitrise CodeCov workflow example

After that, you should be able to fire off a build and if successful you should see your dashboard update at CodeCov.

Austin Taylor
  • 306
  • 3
  • 5
11

I just developed a simple dart package (test_cov_console), so you can run it directly from Android Studio terminal. The tool would read the lcov.info that was generated by flutter test --coverage. Find this link for source code.

You can install the lib globally, so it would not change your current project:

    flutter pub global activate test_cov_console

And run it:

    flutter pub global run test_cov_console

Here is the sample of output:

    flutter pub run test_cov_console
---------------------------------------------|---------|---------|---------|-------------------|
File                                         |% Branch | % Funcs | % Lines | Uncovered Line #s |
---------------------------------------------|---------|---------|---------|-------------------|
lib/src/                                     |         |         |         |                   |
 print_cov.dart                              |  100.00 |  100.00 |   88.37 |...,149,205,206,207|
 print_cov_constants.dart                    |    0.00 |    0.00 |    0.00 |    no unit testing|
lib/                                         |         |         |         |                   |
 test_cov_console.dart                       |    0.00 |    0.00 |    0.00 |    no unit testing|
---------------------------------------------|---------|---------|---------|-------------------|
 All files with unit testing                 |  100.00 |  100.00 |   88.37 |                   |
---------------------------------------------|---------|---------|---------|-------------------|

The output can be saved to CSV file:

flutter pub run test_cov_console -c --output=coverage/test_coverage.csv

Sample CSV output file:

File,% Branch,% Funcs,% Lines,Uncovered Line #s
lib/,,,,
test_cov_console.dart,0.00,0.00,0.00,no unit testing
lib/src/,,,,
parser.dart,100.00,100.00,97.22,"97"
parser_constants.dart,100.00,100.00,100.00,""
print_cov.dart,100.00,100.00,82.91,"29,49,51,52,171,174,177,180,183,184,185,186,187,188,279,324,325,387,388,389,390,391,392,393,394,395,398"
print_cov_constants.dart,0.00,0.00,0.00,no unit testing
All files with unit testing,100.00,100.00,86.07,""
I Made Mudita
  • 480
  • 5
  • 11
9

The Flutter Enhancement Suite does exactly that. It is an Android Studio/IntelliJ plugin which generates coverage reports. It shows the coverage per file and also highlights covered lines (red/green bars next to the line numbers):

Test coverage report shown in Android Studio

  1. install the plugin from the plugin options (Preferences > Plugins > Marketplace tab > Search for Flutter Enhancement Suite).

  2. Create a new Run Configuration for testing with coverage

(Run > Edit Configurations > click the plus button to add a new configuration > Choose Flutter Test in the dropdown)

Add new Run Configuration in Android Studio

  1. Name your configuration (e.g. "All tests"), set the scope and the file or directory containing your tests.

  2. Run your tests with coverage from the top menu.

Launch a Run Configuration in Android Studio.

Kim
  • 1,361
  • 3
  • 18
  • 24
6

With the release of Flutter 2.5, you can now view test coverage within IntelliJ and Android Studio.
See this post

In addition, the latest IJ/AS plugin for Flutter allows you to see the coverage information for both unit test and integration test runs. You can access this from the toolbar button next to the “Debug” button:

Android Studio and IntelliJ: enter image description here

Austin Taylor
  • 306
  • 3
  • 5
5

Coverage reporting is now available on Android Studio

enter image description here

Suraj Rao
  • 29,388
  • 11
  • 94
  • 103
mmccabe
  • 2,259
  • 1
  • 24
  • 25
  • 8
    Unavailable to me, weird. – Panthro Jan 15 '19 at 15:16
  • 1
    Hey I've got the same issue as Panthro, any chance you could let us know which version of Android Studio you got this to work on? – peopletookallthegoodnames Feb 20 '19 at 20:51
  • 1
    I'm currently on Android Studio 3.2... The 'Run with Coverage' option in Android Studio is enabled only for Flutter integration tests for some reason (at least for me). Per the image above, it was working for widget tests. Not sure what happened (don't use it very often) – mmccabe Feb 21 '19 at 00:27
  • 1
    I'm getting `Error: Not found: 'dart:ui'' when I try that option, any idea how to fix that? – SakoDaemon Mar 07 '20 at 09:36
  • It doesn't work for flutter. Might be specific to Dart-only tests – oravecz Nov 29 '20 at 20:19
3

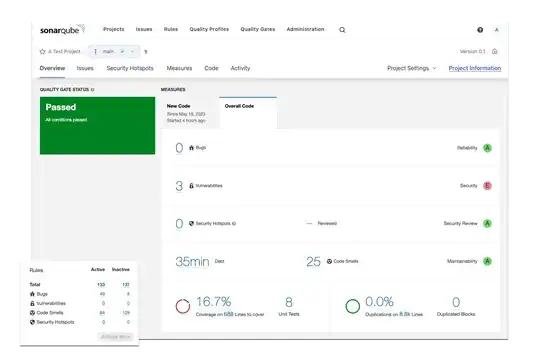
You can use SonarQube with an additional plugin for Flutter as per this link SonarQube plugin for Flutter / Dart.

I have tried it with the free version of SonarQube on docker, and if you have configured it correctly, you just need to run the following commands on Android Studio terminal:

# Download dependencies 
flutter pub get 
# Run tests with User feedback (in case some test are failing)
flutter test
# Run tests without user feedback regeneration tests.output and coverage/lcov.info
flutter test --machine --coverage > tests.output 

# Run the analysis and publish to the SonarQube server
sonar-scanner

Here is the sample of the report, and you can drill deep into line codes. Valid XHTML

I Made Mudita
  • 480
  • 5
  • 11
  • 1
    As explained [there](https://github.com/flutter/flutter/issues/56675#issuecomment-737592032), it's now possible to run tests with --machine & --coverage at the same time. ex: `flutter test --machine --coverage test > tests.output` – Gaëtan S Dec 30 '20 at 08:11
1

FOR WINDOWS

Required:

  • Chocolatey
  • Perl
  • LCOV

1. INSTALL CHOCOLATEY

Open PowerShell (with Admin)

Set-ExecutionPolicy Bypass -Scope Process -Force; iex ((New-Object System.Net.WebClient).DownloadString('https://chocolatey.org/install.ps1'))

2. INSTALL PERL

choco install strawberryperl

Add path to the environmental variable

enter image description here

3. INSTALL LCOV

choco install lcov

LCOV OPERATION

  1. go to the android studio terminal & run this flutter test --coverage
  2. now next, open your project root dir in the power shell in my case (eg :C:\Users\CIPL\Documents\Project\Flutter\myProject)
  3. & run this cmd perl C:\ProgramData\chocolatey\lib\lcov\tools\bin\genhtml coverage/lcov.info -o coverage/html
  4. that's it open the html folder and click the HTML file to view the visual in the browser.

NOTE: when I tried to do 3'rd point, I faced this error "ERROR: cannot create directory 'coverage/html'" enter image description here

so manually created the html folder and tried 3rd point again.

Found this Windows solution in this https://blog.tech-andgar.me/flutter-test-coverage

SaravanaRaja
  • 3,228
  • 2
  • 21
  • 29
0

So, the actual answer is no, you cannot view a coverage report within Android Studio (or in IntelliJ IDEA) at this time.

Unlike JavaScript/TypeScript and Java and probably Python, the IntelliJ IDE (and by extension, Android Studio) do not have integrated IDE support for showing test coverage of Flutter code in the editor. This is a shame because the ability to see your untested code branches and lines highlighted in the source code of your editor is a beautiful thing. Not sure why a plugin for this does not exist yet, since it is well-supported for other languages, and a standard lcov.info file is generated.

There is a bundled code coverage tool window in IntelliJ that is supposed to allow you to browse the lcov.info file in a tree/table drill-down format, but it doesn't seem to work with the coverage report generated by flutter (flutter test --coverage). I thought it might be the relative paths in the lcov.info and my multi-module app structure, but I tried to manually edit the file paths in lcov.info, but I had no luck getting the stats to show.

oravecz
  • 1,146
  • 11
  • 16