I have a very large pandas DataFrame with several thousand codes and the cost associated with each one of them (sample):
data = {'code': ['a', 'b', 'a', 'c', 'c', 'c', 'c'],
        'cost': [10, 20, 100, 10, 10, 500, 10]}
df = pd.DataFrame(data)
I am creating a groupby object at the code level, i.e.,:
grouped = df.groupby('code')['cost'].agg(['sum', 'mean']).apply(pd.Series)
Now I really need to add a new column to this grouped DataFrame, determining the percentage of codes that have outlier costs. My initial approach was this external function (using iqr from scipy):
def is_outlier(s):
    # Only calculate outliers when we have more than 100 observations
    if s.count() >= 100:
        return np.where(s >= s.quantile(0.75) + 1.5 * iqr(s), 1, 0).mean()
    else:
        return np.nan
Having written this function, I added is_outlier to my agg arguments in the groupby above. This did not work, because I am trying to evaluate this is_outlier rate for every element in the cost series:
grouped = df.groupby('code')['cost'].agg(['sum', 'mean', is_outlier]).apply(pd.Series)
I attempted to use pd.Series.where but it does not have the same functionality as the np.where. Is there a way to modify my is_outlier function that has to take the cost series as argument in order to correctly evaluate the outliers rate for each code? Or am I completely off-path?
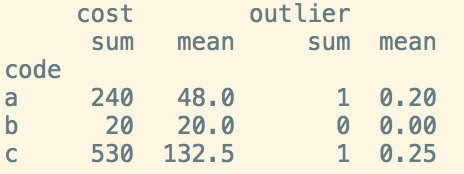
UPDATE Desired Result (minus the minimum observations requirement for this example):
>>> grouped

  code    sum    mean    is_outlier

0  'a'    110     55     0.5
1  'b'    20      20     0
2  'c'    530     132.5  0.25
Note: my sample is terrible in order for me to calculate outliers since I have 2, 1, and 4 observations respectively for each code. In the production data frame each code has hundreds or thousands of observations, each one with a cost associated. In the sample result above, the values for is_outlier mean that, for 'a' one out of the two observations has a cost in the outlier range, for 'c' one out of the four observations has a cost in the outlier range, etc - I am trying to recreate this in my function by assigning 1's and 0's as the result of np.where() and taking the .mean() of that
.apply(pd.Series) is needed in order to cast the <pandas.core.groupby.SeriesGroupBy object> resulting fromgroupbyinto a DataFrame.sis a pandas Series with all values ofcostfor eachcode, as generated from thegroupbyoperation (splitphase ofsplit-apply-combine`)