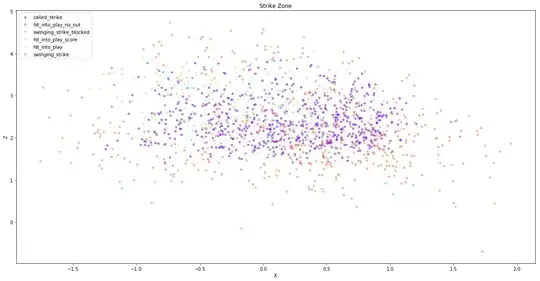
I am new to python and am trying to plot a rolling 2D histogram. I've looked at a bunch of other answers and have come up blank. Here is the problem: I have a series of X, Y, Z points - about 1,500 of them. That when you plot X-Y looks as follows:
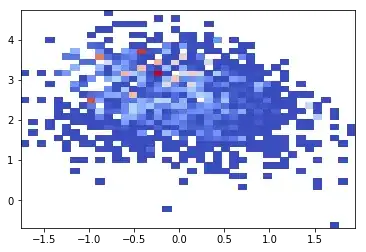
I then want to bin and plot the data according to the Z-value. Here is the core of the code I use:
zi, yi, xi = np.histogram2d(y, x, bins=(bin_size, bin_size), weights=z, normed=False)
counts, _, _ = np.histogram2d(y, x, bins=(bin_size,bin_size))
zi = zi / counts

fig, ax = plt.subplots()
ax.pcolormesh(xi, yi, zi, cmap='coolwarm')
And this is the result:
The data is quite coarse. So what I would like to do is to create a 'rolling average' 2D histogram. I would like to create a rolling average of Z, with a “window” size of 4 inch x 4 inch, in steps of 0.05 feet. Note the X-Y axis are in increments of 1 foot.
So in other words every 0.05 feet (6 inches) I want to draw a 4x4 inch box around this point and measure the number of points. I them want to plot that according to the mean-Z for that 4x4 box and then shift over 0.05 feet.
The result should look something like the below:
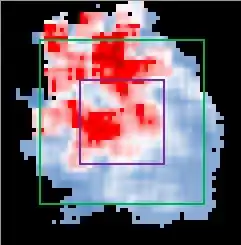
Any help gratefully received