3

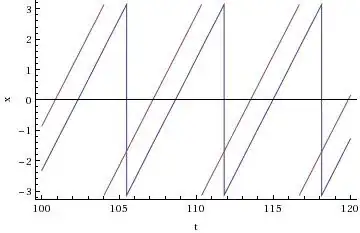
I would like a plot of the instantaneous phase difference between a frequency-swept drive and the nonlinear oscillator it is driving. x[t] below is the instantaneous displacement of the oscillator and plotx provides a plot.

Thanks, Carey

s =
 NDSolve[{x''[t] + x[t] - 0.167 x[t]^3 == 
    0.005 Cos[t - 0.5*0.0000652*t^2], x[0] == 0, x'[0] == 0}, 
  x, {t, 0, 3000}, MaxSteps -> 35000]

plotx = Plot[Evaluate[x[t] /. s], {t, 0, 3000}, PlotPoints -> 10000, 
  Frame -> {True, True, False, False}, FrameLabel -> {"t", "x"}, 
  FrameStyle -> Directive[FontSize -> 15], PlotLabel -> "(a)", 
  Axes -> False]
darioo
  • 46,442
  • 10
  • 75
  • 103
Carey
  • 1,137
  • 3
  • 11
  • 18
  • 1
    What have you tried so far? I think that some of the code given to you in [previous answers](http://stackoverflow.com/questions/4667323/mathematica-envelope-detection-data-smoothing/4668972#4668972) could be used to find the turning points and thus estimate the phase of the oscillator. – Simon Feb 15 '11 at 08:41
  • I guess you could use a less "physics" jargon, to give the non-physicists Mma users an opportunity to understand your problem. Show what is the stimulus and what is the response clearly. – Dr. belisarius Feb 15 '11 at 15:42

2 Answers2

3

(Response, take 2)

You can get a reasonable approximation of the phase with

f[tt_?NumericQ] := -(ArcTan @@ ({x[t], x'[t]}/
    Sqrt[x[t]^2 + x'[t]^2]) /. s[[1]]) /. t -> tt

Here are some plots. First we show the driving term and the result together. It indicates they are a bit out of phase.

plotx2 = Plot[
  Evaluate[{x[t], Cos[t - 0.5*0.0000652*t^2]/5} /. s], {t, 0, 100}, 
  Frame -> {True, True, False, False}, FrameLabel -> {"t", "x"}]

enter image description here

Now we show the two phases together. I plot over a slightly different range this time.

phaseangles = 
 Plot[{f[t], Mod[t - 0.5*0.0000652*t^2, 2*Pi, -Pi]}, {t, 100, 120}, 
  Frame -> {True, True, False, False}, FrameLabel -> {"t", "x"}]

enter image description here

Last we show the phase differences.

phasediffs = 
 Plot[{f[t] - Mod[t - 0.5*0.0000652*t^2, 2*Pi, -Pi]}, {t, 100, 120}, 
  Frame -> {True, True, False, False}, FrameLabel -> {"t", "x"}]

enter image description here

Possibly I'm off by something additive (those Mod[] terms get bothersome), but this should give an idea of how one might proceed.

Daniel Lichtblau Wolfram Research

Daniel Lichtblau
  • 6,854
  • 1
  • 23
  • 30
  • Thank you Daniel for the very helpful details. – Carey Feb 16 '11 at 01:28
  • Hi Daniel, Your suggestion worked well. A question regarding your method of approximating phase: f[tt_?NumericQ] := -(ArcTan @@ ({x[t], x'[t]}/ Sqrt[x[t]^2 + x'[t]^2]) /. s[[1]]) /. t -> tt. I understand phase can be approximated as arctan (quadrature signal/in-phase signal). Why can't that be approximated simply as arctan (x'[t]/x[t])) instead of arctan((x'[t]/ Sqrt[x[t]^2 + x'[t]^2]))/x[t]), i.e., why is x'[t] divided by the hypoteneuse of the signal triangle (x=adjacent side, x'=opposite side) giving the cos of the phase angle in the numerator of the arctan argument? Thanks , Carey – Carey Feb 27 '11 at 16:28
  • 1
    @Cary I think that denominator was a holdover from some earlier attempt, possibly to forestall division by zero problems. From what I can tell in a quick test, it seems to be unnecessary for the current code in question. I should add that if it were in 1-arg ArcTan it would mess up the result. In the 2-arg variant it effectively cancels with itself, so no harm done. – Daniel Lichtblau Feb 27 '11 at 22:24
1

I'd look very closely at the method of averaging. In Strogatz's implementation, both the average envelope and phase of a nonlinear oscillator are found. Since you are looking for something a little bit beyond the first order, I'd consider looking at this paper from the Air Force Academy.

rcollyer
  • 10,475
  • 4
  • 48
  • 75
  • Hi rcollyer, Thank you for the link to the paper on averaging. – Carey Feb 16 '11 at 01:25
  • @Carey, you're welcome. Out of curiosity, what are you working on? – rcollyer Feb 28 '11 at 04:45
  • @rcollyer, I'm doing doctoral research on resonantly forced nonlinear oscillators. – Carey Mar 01 '11 at 21:03
  • @Carey, I had a class using Strogatz's book, and some of the stuff was very interesting. – rcollyer Mar 01 '11 at 21:43
  • 2
    @rcollyer, My course in nonlinear dynamics also used Strogatz's book. It is an excellent text but only only briefly discusses forced (non-autonomous) systems like the ones I am studying. Mathematica is unsurpassed for symbolic computation but I am finding R to be very nice for everything else, especially since it now has good ODE solvers and time series packages. – Carey Mar 05 '11 at 03:26
  • @Carey, how did you make out with those papers? Were they useful? – rcollyer May 12 '11 at 19:42