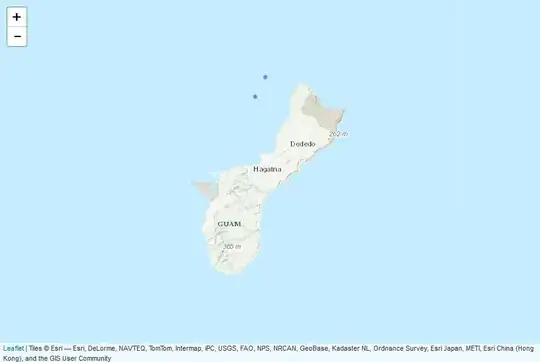
I need to plot my variable Omega as a heat map on the Pacific Ocean. I have the coordinates and the Omega values but ggplot would only plot a world map while my omega appears as a separate figure (See image attached)
This is my data where y and x are Lat and Longs for my sites
    Country Omega     y       x
1   Guam    3.28  144.7822 13.66660
2   Guam    3.28  144.7605 13.62500
This is the code I am using
map.world <- map_data(map = "world")

gg <- ggplot()
gg <- gg + theme(legend.position = "none")
gg <- gg +
    geom_map(data = map.world, map = map.world,
             aes(map_id = region, x = long, y = lat),
             fill = "white", colour = "black", size = 0.25) +
    theme_bw()

omega <- read.csv("map.csv", header = T)

head(omega)

g <- gg +
    geom_polygon() +
    geom_point(data = omega, aes(y = y, x = x, color = Omega)) +
    theme_minimal()

I need to plot my Omega in my study sites and generate a heat map. Please any help would be very appreciated. Thank you very much

