"natvis" is an abbreviation for "native visualizer". Used by the unmanaged debugging engine to provide a customized view of a native object. The .natvisreload command is one that only the unmanaged debugging engine can understand. From the comment it is somewhat obvious how this went wrong:
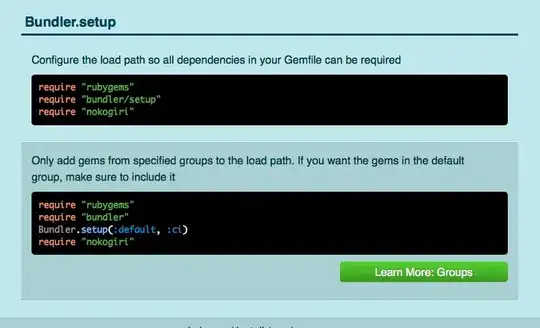
An example of the slug you see when you use File > Open > File to open a minidump for a process that uses managed code. Note the 3 options you have at the upper right to get the debugging started. "Managed Only" only enables the managed debugging engine, "Native Only" for the unmanaged engine, "Mixed" enables both.
You used "Mixed". While that enables both engines, there can be only one active at the same time. Unfortunately it is not always obvious which particular one is in control. Other than the debugger being able to display source code. And a side effect like you discovered here, the ".natvisreload" command goes "huh?" since that is not a command that the managed debugging engine understands.
So one workaround is to use "Native Only".
You can however switch between engines on-the-fly. This normally happens automagically when the debugger lands on a breakpoint. Not an option for dump debugging. The non-intuitive other way is to use the Debug > Windows > Call Stack debugger window. In mixed-mode debugging you see both managed and unmanaged stack frames in the stack, starting with RtlUserThreadStart at the bottom. Double-click one of these frames, like the bottom one, and the debugger switches engines. Note that you don't necessarily have something decent to look at, especially if this was a managed program, and you merely get a machine code dump for the native code. The ".natvisreload" command will however now work as intended.
