14

I have a time series for which I want to intelligently interpolate the missing values. The value at a particular time is influenced by a multi-day trend, as well as its position in the daily cycle.

Here is an example in which the tenth observation is missing from myzoo

start <- as.POSIXct("2010-01-01") 
freq <- as.difftime(6, units = "hours") 
dayvals <- (1:4)*10 
timevals <- c(3, 1, 2, 4) 
index <- seq(from = start, by = freq, length.out = 16)
obs <- (rep(dayvals, each = 4) + rep(timevals, times = 4))
myzoo <- zoo(obs, index)
myzoo[10] <- NA

If I had to implement this, I'd use some kind of weighted mean of close times on nearby days, or add a value for the day to a function line fitted to the larger trend, but I hope there already exist some package or functions that apply to this situation?

EDIT: Modified the code slightly to clarify my problem. There are na.* methods that interpolate from nearest neighbors, but in this case they do not recognize that the missing value is at the time that is the lowest value of the day. Maybe the solution is to reshape the data to wide format and then interpolate, but I wouldn't like to completely disregard the contiguous values from the same day. It is worth noting that diff(myzoo, lag = 4) returns a vector of 10's. The solution may lie with some combination of reshape, na.spline, and diff.inv, but I just can't figure it out.

Here are three approaches that don't work: enter image description here

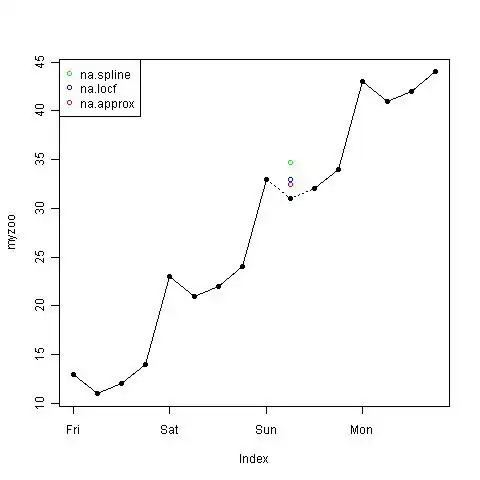
EDIT2. Image produced using the following code.

myzoo <- zoo(obs, index)
myzoo[10] <- NA # knock out the missing point
plot(myzoo, type="o", pch=16) # plot solid line
points(na.approx(myzoo)[10], col = "red")
points(na.locf(myzoo)[10], col = "blue")
points(na.spline(myzoo)[10], col = "green")
myzoo[10] <- 31 # replace the missing point
lines(myzoo, type = "o", lty=3, pch=16) # dashed line over the gap
legend(x = "topleft", 
       legend = c("na.spline", "na.locf", "na.approx"), 
       col=c("green","blue","red"), pch = 1)
J. Win.
  • 6,662
  • 7
  • 34
  • 52

4 Answers4

17

Try this:

x <- ts(myzoo,f=4)
fit <- ts(rowSums(tsSmooth(StructTS(x))[,-2]))
tsp(fit) <- tsp(x)
plot(x)
lines(fit,col=2)

The idea is to use a basic structural model for the time series, which handles the missing value fine using a Kalman filter. Then a Kalman smooth is used to estimate each point in the time series, including any omitted.

I had to convert your zoo object to a ts object with frequency 4 in order to use StructTS. You may want to change the fitted values back to zoo again.

Rob Hyndman
  • 30,301
  • 7
  • 73
  • 85
  • Thanks, that does it almost exactly. But here's something strange: the plot shows the first point of `fit` is pretty far off (by .85), and the sum of (x-fit)^2 is ~0.96. But, if you replace x with `x <- ts(rev(myzoo), f = 4)` the fit becomes perfect. Any idea what happened? – J. Win. Feb 11 '11 at 20:13
  • The `zoo::na.StructTS` function performs lines 2-3 more easily: `fit2 <- na.StructTS(x)` creates a series identical to `x` with the NA filled via the seasonal Kalman filter (30.66, same value as `fit` in this answer). – Max Ghenis Mar 24 '16 at 05:41
2

forecast::na.interp is a good approach. From the documentation

Uses linear interpolation for non-seasonal series and a periodic stl decomposition with seasonal series to replace missing values.

library(forecast)
fit <- na.interp(myzoo)
fit[10]  # 32.5, vs. 31.0 actual and 32.0 from Rob Hyndman's answer

This paper evaluates several interpolation methods against real time series, and finds that na.interp is both accurate and efficient:

From the R implementations tested in this paper, na.interp from the forecast package and na.StructTS from the zoo package showed the best overall results.

The na.interp function is also not that much slower than na.approx [the fastest method], so the loess decomposition seems not to be very demanding in terms of computing time.

Also worth noting that Rob Hyndman wrote the forecast package, and included na.interp after providing his answer to this question. It's likely that na.interp is an improvement upon this approach, even though it performed worse in this instance (probably due to specifying the period in StructTS, where na.interp figures it out).

Max Ghenis
  • 14,783
  • 16
  • 84
  • 132
2

In this case, I think you want a seasonality correction in the ARIMA model. There's not enough date here to fit the seasonal model, but this should get you started.

library(zoo)
start <- as.POSIXct("2010-01-01") 
freq <- as.difftime(6, units = "hours") 
dayvals <- (1:4)*10 
timevals <- c(3, 1, 2, 4) 
index <- seq(from = start, by = freq, length.out = 16)
obs <- (rep(dayvals, each = 4) + rep(timevals, times = 4))
myzoo <- myzoo.orig <- zoo(obs, index)
myzoo[10] <- NA

myzoo.fixed <- na.locf(myzoo)

myarima.resid <- arima(myzoo.fixed, order = c(3, 0, 3), seasonal = list(order = c(0, 0, 0), period = 4))$residuals
myzoo.reallyfixed <- myzoo.fixed
myzoo.reallyfixed[10] <- myzoo.fixed[10] + myarima.resid[10]

plot(myzoo.reallyfixed)
points(myzoo.orig)

In my tests the ARMA(3, 3) is really close, but that's just luck. With a longer time series you should be able to calibrate the seasonal correction to give you good predictions. It would be helpful to have a good prior on what the underlying mechanisms for both the signal and the seasonal correction to get better out of sample performance.

Richard Herron
  • 9,760
  • 12
  • 69
  • 116
  • added an image. plotting is no trouble: `points(na.locf(myzoo)[10], col = "blue")` – J. Win. Feb 11 '11 at 03:09
  • @jonw -- Oh! I misunderstood. I thought the problem was getting _a_ point. The problem is getting good estimate with this "seasonality", which is really a daily seasonality. I should have tried plotting (I just tried `?points.zoo`). – Richard Herron Feb 11 '11 at 03:47
0

Package imputeTS has a method for Kalman Smoothing on the state space representation of an ARIMA model - which might be a good solution for this problem.

library(imputeTS)
na_kalman(myzoo, model = "auto.arima")

Also works directly with zoo time series objects. You could also use your own ARIMA models in this function. If you think you can do better then "auto.arima". This would be done this way:

library(imputeTS)
usermodel <- arima(myts, order = c(1, 0, 1))$model
na_kalman(myts, model = usermodel)

But in this case you have to convert the zoo onject back to ts, since arima() only accepts ts.

Steffen Moritz
  • 7,277
  • 11
  • 36
  • 55